Mathematics, 15.04.2021 21:30 s61371
A pet vaccination clinic keeps track of medicinal needs by recording the weights of pets that come into the clinic. The vaccinations are administered according to weight classes divided up into ten-pound intervals. Would a bar graph or histogram be better for displaying the data, according to the clinic’s needs? Explain.

Answers: 1
Another question on Mathematics

Mathematics, 21.06.2019 17:00
Tom had a total of $220 and he spent $35 on a basketball ticket . what percent of his money did he have left?
Answers: 1

Mathematics, 21.06.2019 17:30
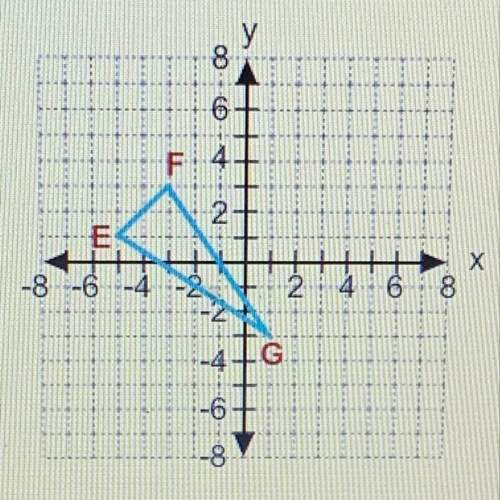
Any is very appreciated! (picture is provided below)not sure how to do this at all won't lie
Answers: 1

Mathematics, 21.06.2019 21:40
Atransformation t : (x,y) (x-5,y +3) the image of a(2,-1) is
Answers: 1

Mathematics, 21.06.2019 21:50
6x + 3y = -6 2x + y = -2 a. x = 0, y = -2 b. infinite solutions c. x = -1, y = 0 d. no solution
Answers: 1
You know the right answer?
A pet vaccination clinic keeps track of medicinal needs by recording the weights of pets that come i...
Questions


Social Studies, 01.10.2019 20:00

History, 01.10.2019 20:00

Business, 01.10.2019 20:00


Mathematics, 01.10.2019 20:00

History, 01.10.2019 20:00

History, 01.10.2019 20:00


Mathematics, 01.10.2019 20:00

History, 01.10.2019 20:00


Physics, 01.10.2019 20:10


Mathematics, 01.10.2019 20:10


