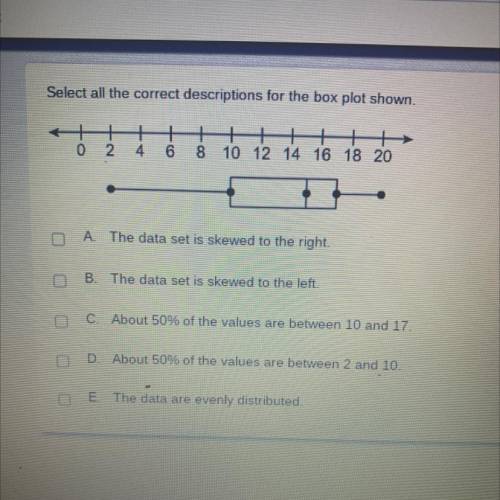
Select all the correct descriptions for the box plot shown.
++
4
0
2
6
8 10 12 14 16 18 20
A. The data set is skewed to the right.
B. The data set is skewed to the left.
C About 50% of the values are between 10 and 17.
D. About 50% of the values are between 2 and 10.
E. The data are evenly distributed.
Mickey needs to cut pieces of ribbon that are each 1 meter long tie onto balloons. if he has 8 pieces of ribbon that are each 1 dekameter long. how many 1 meter pieces of ribbon can he cut