37
Entry Ticket
The dot plot shows the number of touchdowns a football team scored in 10 game...

Mathematics, 16.04.2021 22:20 mikisims
37
Entry Ticket
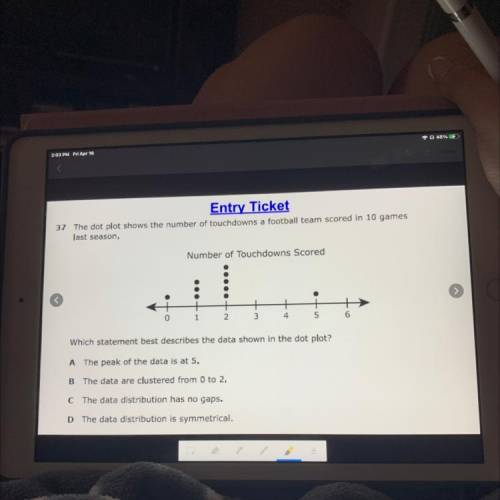
The dot plot shows the number of touchdowns a football team scored in 10 games
last season,
Number of Touchdowns Scored
0
1
2.
3
4
5
6
Which statement best describes the data shown in the dot plot?
A The peak of the data is at 5.
B The data are clustered from 0 to 2,
C The data distribution has no gaps.
D The data distribution is symmetrical.

Answers: 1
Another question on Mathematics
Mathematics, 21.06.2019 16:00
Let the closed interval [a , b] be the domain of function f. the domain of f(x - 3) is given by (a) the open interval (a , b) (b) the closed interval [a , b] (c) the closed interval [a - 3 , b - 3] (d) the closed interval [a + 3 , b + 3]
Answers: 2
Mathematics, 21.06.2019 17:30
What number should be added to the expression x^2+3x+ in order to create a perfect square trinomial? 3/2 3 9/4 9
Answers: 1
Mathematics, 21.06.2019 17:30
Adiverr from the university of florida women’s swimming and diving team is competing in the ncaa zone b championships
Answers: 2
Mathematics, 21.06.2019 23:40
Klmn and pqrs are similar trapezoids. which side of pqrs corresponds to lm
Answers: 1
You know the right answer?
Questions

Chemistry, 28.10.2020 23:20
Mathematics, 28.10.2020 23:20

Mathematics, 28.10.2020 23:20

English, 28.10.2020 23:20

History, 28.10.2020 23:20
Mathematics, 28.10.2020 23:20
Mathematics, 28.10.2020 23:20

Mathematics, 28.10.2020 23:20
Mathematics, 28.10.2020 23:20
English, 28.10.2020 23:20

Mathematics, 28.10.2020 23:20


