
Ido not understand how to do this problem !
6. below is a graph that represents the total pr...

Mathematics, 24.08.2019 13:30 mluz
Ido not understand how to do this problem !
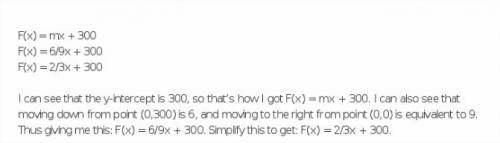
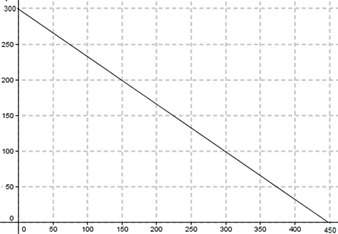
6. below is a graph that represents the total profits for a third month. write the equation of the line that represents this graph. show your work or explain how you determined the equations.
the first month they made 1200 and the second month they made
graph a line using the slope-intercept form:
manipulate the equation into slope-intercept form, y = mx + b.
identify and plot the y-intercept of the line. remember, the y-intercept is b. don't forget: the sign goes with the number.
identify and use the slope of the line to find a second point. remember, the slope is m. don't forget: starting at the y-intercept, the numerator tells you the rise (count up if positive and down if negative), the denominator tells you the run (count right.)
draw a straight line through the two points to complete the graph.
linear functions:
a linear function is a function that is defined by a linear equation.
to write a linear function with function notation, first write it in slope-intercept form, and then replace y with f(x).
the graph of a linear function is all points (x, f( where x is in the domain of the function.

Answers: 2
Another question on Mathematics
Mathematics, 21.06.2019 16:00
Part one: measurements 1. measure your own height and arm span (from finger-tip to finger-tip) in inches. you will likely need some from a parent, guardian, or sibling to get accurate measurements. record your measurements on the "data record" document. use the "data record" to you complete part two of this project. name relationship to student x height in inches y arm span in inches archie dad 72 72 ginelle mom 65 66 sarah sister 64 65 meleah sister 66 3/4 67 rachel sister 53 1/2 53 emily auntie 66 1/2 66 hannah myself 66 1/2 69 part two: representation of data with plots 1. using graphing software of your choice, create a scatter plot of your data. predict the line of best fit, and sketch it on your graph. part three: the line of best fit include your scatter plot and the answers to the following questions in your word processing document 1. 1. which variable did you plot on the x-axis, and which variable did you plot on the y-axis? explain why you assigned the variables in that way. 2. write the equation of the line of best fit using the slope-intercept formula $y = mx + b$. show all your work, including the points used to determine the slope and how the equation was determined. 3. what does the slope of the line represent within the context of your graph? what does the y-intercept represent? 5. use the line of best fit to you to describe the data correlation.
Answers: 2
Mathematics, 21.06.2019 22:30
Which of the following would be a reasonable estimate for the weight of a pencil? a. 1 × 10^-20 lb b. 1 × 10^20 lb c. 1 × 10^2 lb d. 1 × 10^-2 lb
Answers: 1
Mathematics, 21.06.2019 22:40
Suppose you are choosing a 6-digit personal access code. this code is made up of 4 digits chosen from 1 to 9, followed by 2 letters chosen from a to z. any of these digits or letters can be repeated. find the total number of personal access codes that can be formed. 492,804 341,172 39,917,124 4,435,236
Answers: 1
Mathematics, 21.06.2019 22:50
Jim had 15 minutes to do 5 laps around his school what would his time be
Answers: 1
You know the right answer?
Questions

English, 25.11.2019 15:31


History, 25.11.2019 15:31

Geography, 25.11.2019 15:31
Mathematics, 25.11.2019 15:31

Biology, 25.11.2019 15:31
History, 25.11.2019 15:31

Chemistry, 25.11.2019 15:31

Mathematics, 25.11.2019 15:31
Mathematics, 25.11.2019 15:31
History, 25.11.2019 15:31

Mathematics, 25.11.2019 15:31

Business, 25.11.2019 15:31
Physics, 25.11.2019 15:31


