
Mathematics, 26.08.2019 01:30 dndndndnxmnc
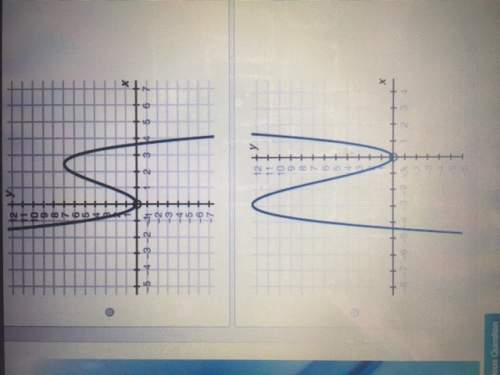
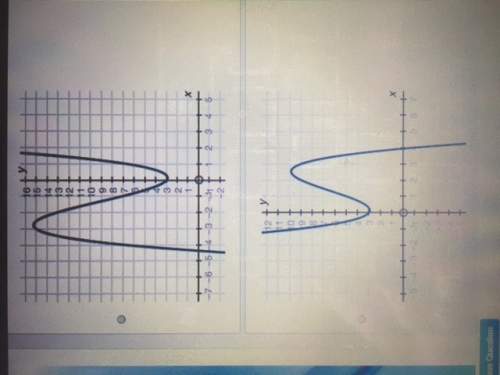
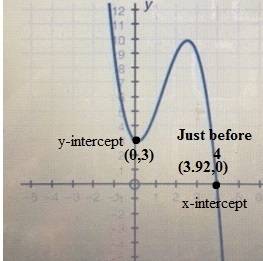
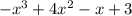
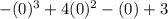
Which of the graphs below represent the function f(x) = − x3 + 4x2 − x + 3? you may sketch the graph to compare.
graph going through x axis at 3.5, passes through y axis at 0.
graph going through x axis at negative 4.5. passes through y axis at 0.
graph going through x axis at negative 4.5. passes through y axis at 3.
graph going through x axis just before 4. passes through y axis at 3.

Answers: 2

 .
. .
.Another question on Mathematics
Mathematics, 21.06.2019 16:20
Under normal conditions, 1.5 feet of snow will melt into 2 inches of water. during a winter season high in the mountains, 301 feet of snow fell. how many inches of water will there be when the snow melts?
Answers: 1
Mathematics, 21.06.2019 20:00
Last one and the bottom answer choice is y=(x-4)^2+1 you guys!
Answers: 1
Mathematics, 21.06.2019 23:00
The weight of a radioactive isotope was 96 grams at the start of an experiment. after one hour, the weight of the isotope was half of its initial weight. after two hours, the weight of the isotope was half of its weight the previous hour. if this pattern continues, which of the following graphs represents the weight of the radioactive isotope over time? a. graph w b. graph x c. graph y d. graph z
Answers: 2
Mathematics, 22.06.2019 02:10
Find the amount of simple interest earned for depositing the given principle in an account if $2200 is invested at 5.5 % for 6 months
Answers: 2
You know the right answer?
Which of the graphs below represent the function f(x) = − x3 + 4x2 − x + 3? you may sketch the grap...
Questions


Biology, 03.07.2020 17:01
Mathematics, 03.07.2020 17:01
Mathematics, 03.07.2020 17:01
Biology, 03.07.2020 17:01

Social Studies, 03.07.2020 17:01

Mathematics, 03.07.2020 17:01

Spanish, 03.07.2020 17:01
Mathematics, 03.07.2020 17:01

History, 03.07.2020 17:01


