Me somebody last ? ?
a group of students were surveyed to find out if they like building sn...

Mathematics, 24.08.2019 16:00 kingalbyss1230
Me somebody last ? ?
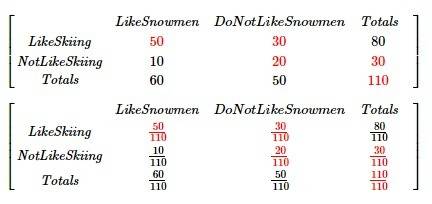
a group of students were surveyed to find out if they like building snowmen or skiing as a winter activity. the results of the survey are shown below:
60 students like building snowmen
10 students like building snowmen but do not like skiing
80 students like skiing
50 students do not like building snowmen
make a two-way table to represent the data and use the table to answer the following questions.
part a: what percentage of the total students surveyed like both building snowmen and skiing? show your work. (5 points)
part b: what is the probability that a student who does not like building snowmen also does not like skiing?

Answers: 2
Another question on Mathematics
Mathematics, 21.06.2019 17:30
Nine more than four times a number is the same as one less than twice the number. find the number?
Answers: 1
Mathematics, 21.06.2019 18:00
Ammonia molecules have three hydrogen atoms and one nitrogen atom.how many of each atom arein five molecules of ammonia
Answers: 1
Mathematics, 21.06.2019 22:40
Awoman has 14 different shirts: 10 white shirts and 4 red shirts. if she randomly chooses 2 shirts to take with her on vacation, then what is the probability that she will choose two white shirts? show your answer in fraction and percent, round to the nearest whole percent.
Answers: 3
You know the right answer?
Questions

Chemistry, 07.05.2021 16:40
Mathematics, 07.05.2021 16:40
Mathematics, 07.05.2021 16:40


Physics, 07.05.2021 16:40
Mathematics, 07.05.2021 16:40

Health, 07.05.2021 16:40

Business, 07.05.2021 16:40
Mathematics, 07.05.2021 16:40
Mathematics, 07.05.2021 16:40
Mathematics, 07.05.2021 16:40
Business, 07.05.2021 16:40
English, 07.05.2021 16:40


