
Mathematics, 02.10.2019 13:10 chamarabrown6529
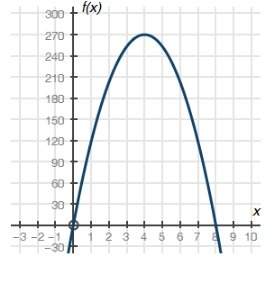
The graph below shows a company's profit f(x), in dollars, depending on the price of erasers x, in dollars, being sold by the company:
graph of quadratic function f of x having x intercepts at ordered pairs 0, 0 and 8, 0. the vertex is at 4, 270
part a: what do the x-intercepts and maximum value of the graph represent? what are the intervals where the function is increasing and decreasing, and what do they represent about the sale and profit?
part b: what is an approximate average rate of change of the graph from x = 1 to x = 4, and what does this rate represent?

Answers: 1
Another question on Mathematics
Mathematics, 21.06.2019 15:50
Dylan and dusty plan to take weekly surfing lessons together. if the 2-hour lessons are $20 per person and they plan to spend $100 each on new surfboards, what is the maximum number of lessons the two can take if the total amount spent for lessons and surfboards is at most $480?
Answers: 1
Mathematics, 21.06.2019 17:20
If you are just building your payment history, how many points from a perfect score will you possibly miss?
Answers: 1
Mathematics, 21.06.2019 17:50
To solve the system of equations below, grace isolated the variable y in the first equation and then substituted into the second equation. what was the resulting equation? 3y=12x x^2/4+y^2/9=1
Answers: 1
Mathematics, 21.06.2019 19:30
Mrs. gehrke said cheddar weighs 16.8 pounds. he actually weighs 15.2 pounds. what is the percent error?
Answers: 1
You know the right answer?
The graph below shows a company's profit f(x), in dollars, depending on the price of erasers x, in d...
Questions


Mathematics, 29.06.2021 20:00

Chemistry, 29.06.2021 20:00


Chemistry, 29.06.2021 20:00
Mathematics, 29.06.2021 20:00
Chemistry, 29.06.2021 20:00
Mathematics, 29.06.2021 20:00
Chemistry, 29.06.2021 20:00
Business, 29.06.2021 20:00

Mathematics, 29.06.2021 20:00
Health, 29.06.2021 20:00


