
Mathematics, 01.10.2019 16:30 smileyjesse6073
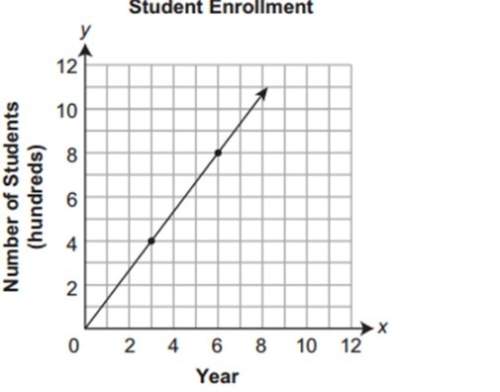
Aschool has collected student enrollment data since it opened. the graph below shows the number of students (y), in hundreds, enrolled at the school each year (x) the school has been open.
which statement best describes the change in student enrollment shown in the graph?
a. enrollment has increased by approximately 400 students per year.
b. enrollment has increased by approximately 1.3 students per year.
c. enrollment has increased by approximately 133 students per year.
d. enrollment has increased by approximately 1,100 students per year.

Answers: 1
Another question on Mathematics
Mathematics, 21.06.2019 17:00
Tim's phone service charges $23.06 plus an additional $0.22 for each text message sent per month. if tim's phone bill was $28.56, which equation could be used to find how many text messages, x, tim sent last month?
Answers: 2
Mathematics, 21.06.2019 20:00
Which of the following is the inverse of y = 3∧x y = 1/3∧x y = ㏒3x y = (1/3) ∧x y = ㏒ 1/3∧x
Answers: 1
Mathematics, 22.06.2019 00:00
If 7x=9y, y/z = 7/5 , then x/z = (a) 2/7 (b) 7/9 (c) 9/5 (d) 9/7 (e) 5/9
Answers: 1
You know the right answer?
Aschool has collected student enrollment data since it opened. the graph below shows the number of s...
Questions
Mathematics, 02.06.2020 04:59
Mathematics, 02.06.2020 04:59

Biology, 02.06.2020 05:57
Mathematics, 02.06.2020 05:57
Mathematics, 02.06.2020 05:57
Mathematics, 02.06.2020 05:57


Mathematics, 02.06.2020 05:57
Mathematics, 02.06.2020 05:57

Computers and Technology, 02.06.2020 05:57
Mathematics, 02.06.2020 05:57


