Plz
the scatter plot shows the relationship between the number of car accidents in a mon...

Mathematics, 18.12.2019 00:31 tuetheturtle
Plz
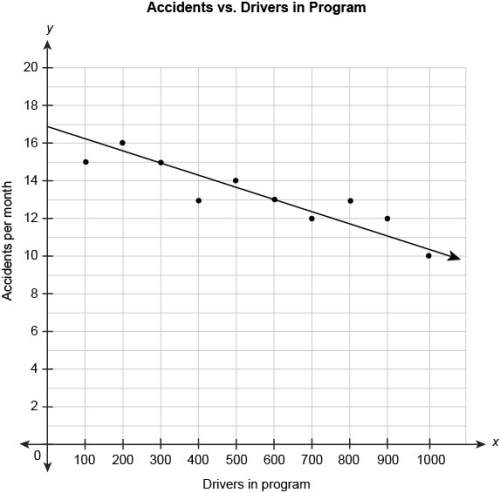
the scatter plot shows the relationship between the number of car accidents in a month and the number of drivers attending a program on distracted driving. the equation represents the linear model for this data.
y = -0.67x + 17
what does the number -0.67 in the equation mean in this context?
a .there were 0.67 accidents per month.
b. the number of accidents was reduced by 0.67 per month every month.
c. the number of accidents was reduced by 0.67 per month for every additional driver in the program.
d. the number of accidents was reduced by 0.67 per month for every additional 100 drivers in the program
e. the number of accidents increased by 0.67 per month for every additional 100 drivers in the program

Answers: 3
Another question on Mathematics
Mathematics, 21.06.2019 16:00
Which term best describes the association between variables a and b? no association a negative linear association a positive linear association a nonlinear association a scatterplot with an x axis labeled, variable a from zero to ten in increments of two and the y axis labeled, variable b from zero to one hundred forty in increments of twenty with fifteen points in a positive trend.
Answers: 2
Mathematics, 21.06.2019 19:30
Find the commission on a $590.00 sale if the commission is 15%.
Answers: 2
Mathematics, 21.06.2019 20:30
Find the area of the triangle formed by the origin and the points of intersection of parabolas y=−3x^2+20 and y=x^2−16.
Answers: 3
You know the right answer?
Questions

Mathematics, 19.11.2020 22:10


Biology, 19.11.2020 22:10

French, 19.11.2020 22:10
Mathematics, 19.11.2020 22:10

Chemistry, 19.11.2020 22:10
Mathematics, 19.11.2020 22:10
Mathematics, 19.11.2020 22:10

Chemistry, 19.11.2020 22:10
Mathematics, 19.11.2020 22:10


