
Mathematics, 04.02.2020 08:51 foodisbae45678
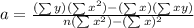
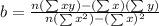
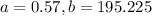
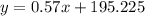
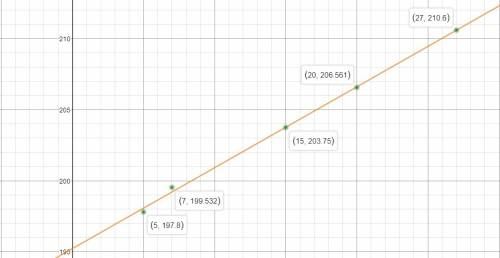
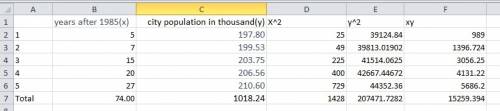
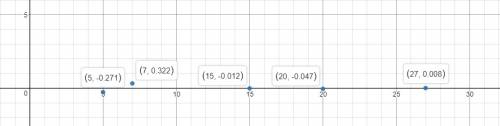
The table shows the population of center city in various years. use the data from 1990 and 2005 to create a linear model that predicts the population of the city (y) in a given year (x). in which year was the actual population of center city most different from the value predicted by this model?
year city population
1985 194,957
1990 197,800
1992 199,532
2000 203,750
2005 206,561
2012 210,600
a) 1985
b) 1992
c) 2000
d) 2012

Answers: 1

Another question on Mathematics
Mathematics, 21.06.2019 18:30
An optical inspection system is used to distinguish among different part types. the probability of a correct classification of any part is 0.92. suppose that three parts are inspected and that the classifications are independent. let the random variable x denote the number of parts that are correctly classified. determine the probability mass function of x. round your answers to four decimal places (e.g. 98.7654). x f(x) 0 1 2 3
Answers: 2
Mathematics, 22.06.2019 03:30
3a + 5b - 7 = 0 a - 2b - 4 = 0 solve the system by the elimination method. check your work {(96/11, -5/11)} {(34/11, -5/11)} {(32/33, 5/11)}
Answers: 1
Mathematics, 22.06.2019 04:10
Acoin is tossed 4 times which of the following represents the probability of the coin landing on heads all 4 times
Answers: 1
You know the right answer?
The table shows the population of center city in various years. use the data from 1990 and 2005 to c...
Questions
Mathematics, 10.07.2019 15:00


Social Studies, 10.07.2019 15:00


Physics, 10.07.2019 15:00


Biology, 10.07.2019 15:00
Mathematics, 10.07.2019 15:00
Mathematics, 10.07.2019 15:00
Mathematics, 10.07.2019 15:00
Mathematics, 10.07.2019 15:00
History, 10.07.2019 15:00


