
Mathematics, 05.10.2019 11:00 harlon852
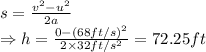
Aball is kicked upward with an initial velocity of 68 feet per second. the ball's height, h (in feet), from the ground where it is measured in seconds. how much time does the ball take to reach its highest point? what is its height at this point?

Answers: 2
Another question on Mathematics
Mathematics, 21.06.2019 20:30
If m∠abc = 70°, what is m∠abd? justify your reasoning. using the addition property of equality, 40 + 70 = 110, so m∠abd = 110°. using the subtraction property of equality, 70 − 30 = 40, so m∠abd = 30°. using the angle addition postulate, 40 + m∠abd = 70. so, m∠abd = 30° using the subtraction property of equality. using the angle addition postulate, 40 + 70 = m∠abd. so, m∠abd = 110° using the addition property of equality.
Answers: 2
Mathematics, 21.06.2019 23:00
Each of the following data sets has a mean of x = 10. (i) 8 9 10 11 12 (ii) 7 9 10 11 13 (iii) 7 8 10 12 13 (a) without doing any computations, order the data sets according to increasing value of standard deviations. (i), (iii), (ii) (ii), (i), (iii) (iii), (i), (ii) (iii), (ii), (i) (i), (ii), (iii) (ii), (iii), (i) (b) why do you expect the difference in standard deviations between data sets (i) and (ii) to be greater than the difference in standard deviations between data sets (ii) and (iii)? hint: consider how much the data in the respective sets differ from the mean. the data change between data sets (i) and (ii) increased the squared difference îł(x - x)2 by more than data sets (ii) and (iii). the data change between data sets (ii) and (iii) increased the squared difference îł(x - x)2 by more than data sets (i) and (ii). the data change between data sets (i) and (ii) decreased the squared difference îł(x - x)2 by more than data sets (ii) and (iii). none of the above
Answers: 2
Mathematics, 22.06.2019 01:30
Asample of 200 rom computer chips was selected on each of 30 consecutive days, and the number of nonconforming chips on each day was as follows: the data has been given so that it can be copied into r as a vector. non.conforming = c(10, 15, 21, 19, 34, 16, 5, 24, 8, 21, 32, 14, 14, 19, 18, 20, 12, 23, 10, 19, 20, 18, 13, 26, 33, 14, 12, 21, 12, 27) #construct a p chart by using the following code. you will need to enter your values for pbar, lcl and ucl. pbar = lcl = ucl = plot(non.conforming/200, ylim = c(0,.5)) abline(h = pbar, lty = 2) abline(h = lcl, lty = 3) abline(h = ucl, lty = 3)
Answers: 3
Mathematics, 22.06.2019 02:20
What are the solutions of the equation x4 – 5x2 – 14 = 0? use factoring to solve. someone !
Answers: 2
You know the right answer?
Aball is kicked upward with an initial velocity of 68 feet per second. the ball's height, h (in feet...
Questions

English, 08.10.2019 16:10
Mathematics, 08.10.2019 16:10

Social Studies, 08.10.2019 16:10


Mathematics, 08.10.2019 16:10


History, 08.10.2019 16:10


