which word describes the slope of the line?

Mathematics, 14.10.2019 18:50 Horse0809
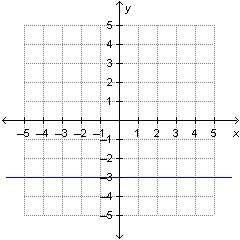
The graph of a linear function is shown.
which word describes the slope of the line?
positive
negative
zero
undefined

Answers: 2
Another question on Mathematics
Mathematics, 20.06.2019 18:04
What is the common difference in the following arithmetic sequence? 7,3,-1,-5
Answers: 1
Mathematics, 22.06.2019 00:30
Paula makes stained-glass windows and sells them to boutique stores. if her costs total $12,000 per year plus $4 per window for the frame. how many windows must she produce to earn a profit of at least $48,000 in one year if she sells the windows for $28 each? 1. define a variable for the situation. 2. write an inequality that represents her profit. note: revenue is money coming in. cost is money going out. profit is the difference between the revenue and the cost. in other words: revenue - costs profit 3.using words, describe how many windows she must sell to have a profit of at least $48,000.
Answers: 1
Mathematics, 22.06.2019 03:00
Describe how the presence of possible outliers might be identified on the following. (a) histograms gap between the first bar and the rest of bars or between the last bar and the rest of bars large group of bars to the left or right of a gap higher center bar than surrounding bars gap around the center of the histogram higher far left or right bar than surrounding bars (b) dotplots large gap around the center of the data large gap between data on the far left side or the far right side and the rest of the data large groups of data to the left or right of a gap large group of data in the center of the dotplot large group of data on the left or right of the dotplot (c) stem-and-leaf displays several empty stems in the center of the stem-and-leaf display large group of data in stems on one of the far sides of the stem-and-leaf display large group of data near a gap several empty stems after stem including the lowest values or before stem including the highest values large group of data in the center stems (d) box-and-whisker plots data within the fences placed at q1 â’ 1.5(iqr) and at q3 + 1.5(iqr) data beyond the fences placed at q1 â’ 2(iqr) and at q3 + 2(iqr) data within the fences placed at q1 â’ 2(iqr) and at q3 + 2(iqr) data beyond the fences placed at q1 â’ 1.5(iqr) and at q3 + 1.5(iqr) data beyond the fences placed at q1 â’ 1(iqr) and at q3 + 1(iqr)
Answers: 1
You know the right answer?
The graph of a linear function is shown.
which word describes the slope of the line?
which word describes the slope of the line?
Questions

Chemistry, 19.03.2020 01:13
Mathematics, 19.03.2020 01:13

History, 19.03.2020 01:13
Mathematics, 19.03.2020 01:13
Mathematics, 19.03.2020 01:13
Chemistry, 19.03.2020 01:14
Mathematics, 19.03.2020 01:14

Mathematics, 19.03.2020 01:14

English, 19.03.2020 01:14

Social Studies, 19.03.2020 01:14
English, 19.03.2020 01:14

Computers and Technology, 19.03.2020 01:14
History, 19.03.2020 01:14


