
Mathematics, 28.01.2020 18:09 dbegay36
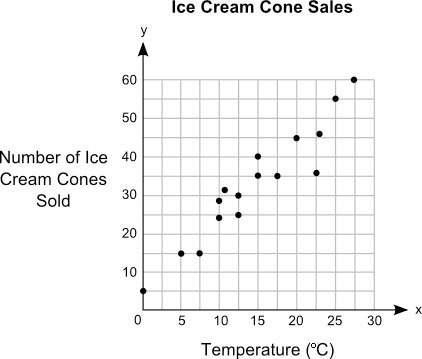
Jack plotted the graph below to show the relationship between the temperature of his city and the number of ice cream cones he sold daily:
part a: in your own words, describe the relationship between the temperature of the city and the number of ice cream cones sold. (5 points)
part b: describe how you can make the line of best fit. write the approximate slope and y-intercept of the line of best fit. show your work, including the points that you use to calculate slope and y-intercept. (5 points)

Answers: 2
Another question on Mathematics
Mathematics, 21.06.2019 12:30
The bike store marks up the wholesale cost of all the bikes they sell by 30% and andre wants to buy a bike that has a price tag of 125 what was the wholesale cost of the bike
Answers: 3
Mathematics, 21.06.2019 17:10
Complete the table for different values of x in the polynomial expression -7x2 + 32x + 240. then, determine the optimal price that the taco truck should sell its tacos for. assume whole dollar amounts for the tacos.
Answers: 2
Mathematics, 21.06.2019 21:30
One astronomical unit (1 au) is about 1.496 alt tag missing. kilometers. if you wrote this number of kilometers in regular decimal notation (for example, 528 and 3,459 are written in regular decimal notation), how many zeros would your number have?
Answers: 1
You know the right answer?
Jack plotted the graph below to show the relationship between the temperature of his city and the nu...
Questions
Mathematics, 07.04.2020 21:21


Computers and Technology, 07.04.2020 21:22


Health, 07.04.2020 21:22
English, 07.04.2020 21:22
Mathematics, 07.04.2020 21:22

English, 07.04.2020 21:22


Mathematics, 07.04.2020 21:22


