
Mathematics, 26.12.2019 14:31 jasminelynn135owmyj1
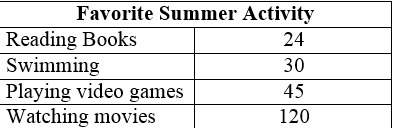
Delany wants to find out the way her friends are spending their summer vacation. she surveys a large number of students at a movie theater about their favorite summer activity. the results of her survey are shown on the table below.
picture inserted down below
delany bases her conclusion on the results of her survey. she concludes that the favorite summer activity of most students is watching movies. which statement best describes delany's conclusion?
a. delany's conclusion is not valid because she surveyed only students.
b. delany's conclusion is valid because she surveyed a large number of students.
c. delany's conclusion is valid because she surveyed students from many schools.
d. delany's conclusion is not valid because she surveyed students at a movie theater.
forever 21 is a local clothing store for teens. on saturday a journalist for a teen magazine surveyed teenagers leaving this clothing store to determine which brand of clothing they like best. which statement best explains why the results of this survey may not be valid?
a. the survey could have been conducted online.
b. the group surveyed consisted only of teenagers
c. the survey was conducted by a journalist from only one magazine.
d. the group surveyed consisted only of teenagers who shopped at the forever 21.

Answers: 1
Another question on Mathematics
Mathematics, 21.06.2019 14:30
The amount of money, in dollars, in an account after t years is given by a = 1000(1.03)^t. the initial deposit into the account was $_^a0 and the interest rate was _a1% per year. only enter numbers in the boxes. do not include any commas or decimal points^t. the initial deposit into the account was $__^a0 and the interest rate is % per year.
Answers: 2
Mathematics, 21.06.2019 19:30
Which of the following describes the symmetry of the graph of y = x3?
Answers: 2
Mathematics, 21.06.2019 19:40
Ascatter plot with a trend line is shown below. which equation best represents the given data? y = x + 2 y = x + 5 y = 2x + 5
Answers: 1
Mathematics, 21.06.2019 20:20
Consider the following estimates from the early 2010s of shares of income to each group. country poorest 40% next 30% richest 30% bolivia 10 25 65 chile 10 20 70 uruguay 20 30 50 1.) using the 4-point curved line drawing tool, plot the lorenz curve for bolivia. properly label your curve. 2.) using the 4-point curved line drawing tool, plot the lorenz curve for uruguay. properly label your curve.
Answers: 2
You know the right answer?
Delany wants to find out the way her friends are spending their summer vacation. she surveys a large...
Questions

Chemistry, 07.07.2019 08:00
Mathematics, 07.07.2019 08:00
Mathematics, 07.07.2019 08:00
Mathematics, 07.07.2019 08:00
Mathematics, 07.07.2019 08:00
Mathematics, 07.07.2019 08:00

English, 07.07.2019 08:00

History, 07.07.2019 08:00
History, 07.07.2019 08:00
Mathematics, 07.07.2019 08:00

Arts, 07.07.2019 08:00

World Languages, 07.07.2019 08:00
English, 07.07.2019 08:00
English, 07.07.2019 08:00


