Mathematics, 22.09.2019 04:30 aidanw
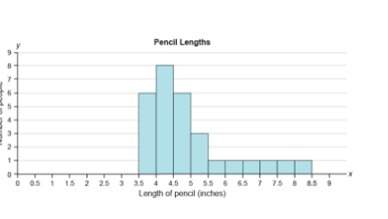
The histogram shows the lengths of pencils people in a study were using. which description best fits the distribution of the data shown in the histogram? a. approximately bell-shaped
b. skewed left
c. uniform
d. skewed right


Answers: 2
Another question on Mathematics

Mathematics, 21.06.2019 19:30
We just started the introduction into circles and i have no idea how to do this.
Answers: 3

Mathematics, 21.06.2019 19:40
What is the slope of the line that contains the points (-2,1) and (0,-3)
Answers: 2

Mathematics, 22.06.2019 01:00
Ameteorologist is studying the monthly rainfall in a section of the brazilian rainforest. she recorded the monthly rainfall, in inches, for last year. they were: 10.4, 10.3, 11.7, 11.1, 8.0, 4.4, 2.6, 1.8, 2.5, 4.4, 7.3, 9.5 fill in the missing values in the formula. what is the variance?
Answers: 1

Mathematics, 22.06.2019 02:50
Aresearcher believes increased perceived control influence the well-being of residents at a nursing home. to test this , she allowed one group of residents to have control over their daily lies, (where to eat etc) . the other group of 5 residents had these deceisions made by staff. the resident's feelings of well-being were measured on a 10 point scale at the end of a one month trial period. is there a difference on well-being?
Answers: 2
You know the right answer?
The histogram shows the lengths of pencils people in a study were using. which description best fits...
Questions

Mathematics, 12.10.2020 22:01

History, 12.10.2020 22:01


Mathematics, 12.10.2020 22:01

Mathematics, 12.10.2020 22:01

History, 12.10.2020 22:01


History, 12.10.2020 22:01


Chemistry, 12.10.2020 22:01


