
Mathematics, 05.12.2019 10:31 tttyson
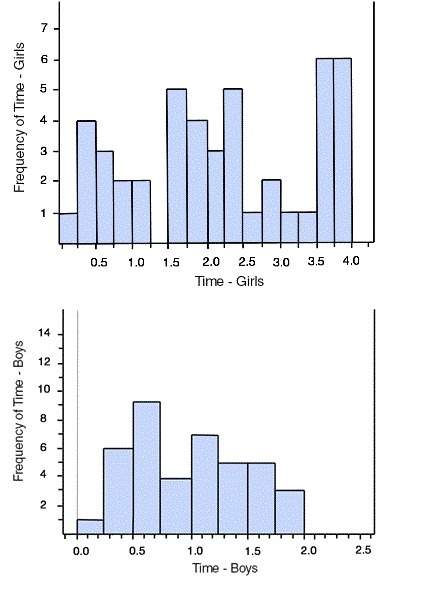
These histograms graph the amount of time (hours per day) that 46 middle school girls and 40 middle school boys in san francisco spend on the website facespace. 50 boys and 50 girls took the survey but 4 girls and 10 boys did not use these sites at all. each is graphed with a bar width of 0.25 hours.
how many boys spent between 0.5 hour and 0.75 hour on the site?
6
8
9
10

Answers: 3
Another question on Mathematics
Mathematics, 21.06.2019 23:10
Use the distance formula to find the distance between (-3,5) and (3,1)
Answers: 1
Mathematics, 22.06.2019 01:00
Asandwich shop has 18 tables. each table seats up to 4 people. to find the greatest number of people that can be seated, you can solve p4 ≤ 18. which step is the best way to solve the inequality? plz asap i repeat plz
Answers: 2
Mathematics, 22.06.2019 01:50
Whats the theoretical probability of popping a polka dot balloon? express your answer as a fraction, decimal and percent solid 15 polka dot 5 striped 17 plzz me due tomorrow
Answers: 2
Mathematics, 22.06.2019 04:00
Brad earns $12.75/hr and works 40 hours a week. what is his gross annual income?
Answers: 1
You know the right answer?
These histograms graph the amount of time (hours per day) that 46 middle school girls and 40 middle...
Questions
Mathematics, 13.04.2021 17:30
Mathematics, 13.04.2021 17:30

English, 13.04.2021 17:30


Mathematics, 13.04.2021 17:30

English, 13.04.2021 17:30
English, 13.04.2021 17:30
Mathematics, 13.04.2021 17:30

Mathematics, 13.04.2021 17:30


