
Mathematics, 16.09.2019 18:30 jalaholmes2027
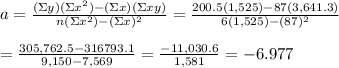
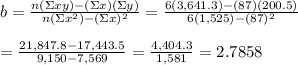
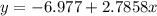
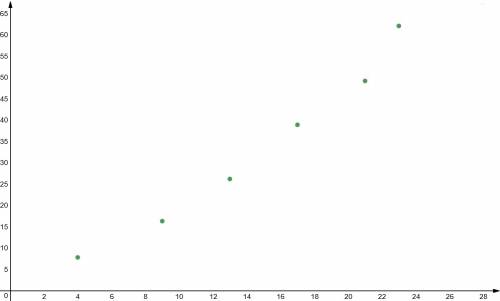
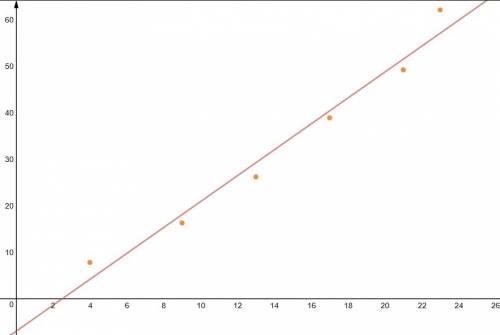
The following table shows the percent increase of donations made on behalf of a non-profit organization for the period of 1984 to 2003. use a graphing calculator to make a scatter plot of the data. find an equation for and graph the line of regression. then use the equation to predict the percent donated in the year 2015.

Answers: 1
![\begin{center} \begin{tabular}{ c| c| c| c| } x & y & x^2 & xy \\ [1ex] 4 & 7.8 & 16 & 31.2 \\ 9 & 16.3 & 81 & 146.7 \\ 13 & 26.2 & 169 & 340.6 \\ 17 & 38.9 & 289 & 661.3 \\ 21 & 49.2 & 441 & 1,033.2 \\ 23 & 62.1 & 529 & 1,428.3 \\ [1ex] \Sigma x=87 & \Sigma y=200.5 & \Sigma x^2=1,525 & \Sigma xy=3,641.3 \end{tabular} \end{center}](/tpl/images/0233/7820/26caa.png)


Another question on Mathematics
Mathematics, 21.06.2019 23:30
Drag each equation to the correct location on the table. for each equation, determine the number of solutions and place on the appropriate field in the table.
Answers: 3
Mathematics, 22.06.2019 00:00
Which diagram shows lines that must be parallel lines cut by transversal?
Answers: 3
You know the right answer?
The following table shows the percent increase of donations made on behalf of a non-profit organizat...
Questions

Chemistry, 28.04.2021 14:00

Mathematics, 28.04.2021 14:00

Geography, 28.04.2021 14:00

Mathematics, 28.04.2021 14:00
Mathematics, 28.04.2021 14:00
English, 28.04.2021 14:00
Mathematics, 28.04.2021 14:00
Mathematics, 28.04.2021 14:00
English, 28.04.2021 14:00

Computers and Technology, 28.04.2021 14:00


