
Mathematics, 16.01.2020 16:31 emmeaw245
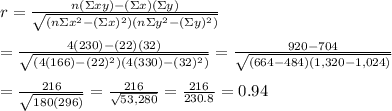
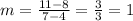
The table below shows the radius y, in inches, created by growing algae in x days: time (x) (days) 1 4 7 10 radius (y) (inches) 1 8 11 12 part a: what is the most likely value of the correlation coefficient of the data in the table? based on the correlation coefficient, describe the relationship between time and radius of the algae. [choose the value of the correlation coefficient from 1, 0.94, 0.5, 0.02.] (4 points) part b: what is the value of the slope of the graph of radius versus time between 4 and 7 days, and what does the slope represent? (3 points) part c: does the data in the table represent correlation or causation? explain your answer. (3 points)

Answers: 1
![\begin{center} \begin{tabular} {|c|c|c|c|c|} x & y & x^2 & y^2 & xy \\ [1ex] 1 & 1 & 1 & 1 & 1\\ 4 & 8 & 16 & 64 & 32\\ 7 & 11 & 49 & 121 & 77\\ 10 & 12 & 100 & 144 & 120\\ [1ex] \Sigma x=22 & \Sigma y=32 & \Sigma x^2=166 & \Sigma y^2=330 & \Sigma xy=230 \end{tabular} \end{center}](/tpl/images/0457/8085/5dee6.png)
 and
and 

Another question on Mathematics
Mathematics, 21.06.2019 14:30
Explain why the two figures below are not similar. use complete sentences and provide evidence to support your explanation. (10 points) figure abcdef is shown. a is at negative 4, negative 2. b is at negative 3, 0. c is at negative 4, 2. d is at negative 1, 2. e
Answers: 3
Mathematics, 21.06.2019 16:00
Solve for x -2.3(r - 1.2 ) = -9.66 enter you answer as decimal.
Answers: 1
Mathematics, 22.06.2019 01:00
Ineed to know how to write question one in mathematical terms
Answers: 1
You know the right answer?
The table below shows the radius y, in inches, created by growing algae in x days: time (x) (days)...
Questions
Mathematics, 25.01.2021 02:50

History, 25.01.2021 02:50

Mathematics, 25.01.2021 03:00
History, 25.01.2021 03:00
Mathematics, 25.01.2021 03:00
Mathematics, 25.01.2021 03:00
Mathematics, 25.01.2021 03:00
Mathematics, 25.01.2021 03:00

Mathematics, 25.01.2021 03:00
Mathematics, 25.01.2021 03:00
Mathematics, 25.01.2021 03:00

Health, 25.01.2021 03:00

Social Studies, 25.01.2021 03:00
Mathematics, 25.01.2021 03:00


