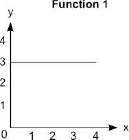
The graph represents function 1 and the equation represents function 2:
a graph with nu...

Mathematics, 02.12.2019 11:31 ekj6106
The graph represents function 1 and the equation represents function 2:
a graph with numbers 0 to 4 on the x-axis and y-axis at increments of 1. a horizontal straight line is drawn joining the ordered pairs 0, 3 and 4, 3.
function 2
y = 6x + 1
how much more is the rate of change of function 2 than the rate of change of function 1?
a. 5
b. 6
c. 7
d. 8

Answers: 1
Another question on Mathematics
Mathematics, 21.06.2019 16:00
Find the average speed of a rabbit that runs a distance of 22 m in a time of 1.8 s .
Answers: 1
Mathematics, 21.06.2019 18:00
Lydia collected two sets of data one set of data shows an outlier. which set has an outlier, and which number is the outlier?
Answers: 2
Mathematics, 21.06.2019 19:40
Neoli is a nurse who works each day from 8: 00 am to 4: 00 pm at the blood collection centre. she takes 45 minutes for her lunch break. on average, it takes neoli 15 minutes to collect each sample and record the patient's details. on average, how many patients can neoli see each day?
Answers: 3
Mathematics, 21.06.2019 22:30
For the chance to be team captain, the numbers 1-30 are put in a hat and you get two chances to pick a number, without replacement. which formula correctly shows how to find the probability that you choose the number 1 and then 2?
Answers: 1
You know the right answer?
Questions
Mathematics, 23.07.2019 06:00

History, 23.07.2019 06:00
Mathematics, 23.07.2019 06:00

History, 23.07.2019 06:00

English, 23.07.2019 06:00

English, 23.07.2019 06:00

History, 23.07.2019 06:00
English, 23.07.2019 06:00
Mathematics, 23.07.2019 06:00


