Mathematics, 09.01.2020 10:31 rjsimpson73
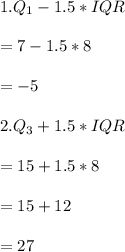
The table below shows data from a survey about the amount of time high school students spent reading and the amount of time spent watching videos each week (without reading): reading video 5 1 5 4 7 7 7 10 7 12 12 15 12 15 12 18 14 21 15 26 which response best describes outliers in these data sets?
a) neither data set has suspected outliers.
b) the range of data is too small to identify outliers.
c) video has a suspected outlier in the 26-hour value.
d) due to the narrow range of reading compared to video, the video values of 18, 21, and 26 are all possible outliers.

Answers: 1
Another question on Mathematics

Mathematics, 21.06.2019 18:40
What is the value of the expression below? 148+(-6)| + |– 35= 7|
Answers: 2

Mathematics, 21.06.2019 18:50
The number of fish in a lake can be modeled by the exponential regression equation y=14.08 x 2.08^x where x represents the year
Answers: 3

Mathematics, 21.06.2019 21:30
Look at the figure below: triangle abc is a right triangle with angle abc equal to 90 degrees. the length of ac is 5 units and the length of ab is 4 units. d is a point above c. triangle adc is a right triangle with angle dac equal to 90 degrees and dc parallel to ab. what is the length, in units, of segment cd?
Answers: 1

You know the right answer?
The table below shows data from a survey about the amount of time high school students spent reading...
Questions

Arts, 11.06.2020 05:57


English, 11.06.2020 05:57

Mathematics, 11.06.2020 05:57


Mathematics, 11.06.2020 05:57


History, 11.06.2020 05:57


Mathematics, 11.06.2020 05:57

Mathematics, 11.06.2020 05:57


Mathematics, 11.06.2020 05:57


Computers and Technology, 11.06.2020 05:57


