
Mathematics, 03.11.2019 11:31 jeffylovesgreenbeans
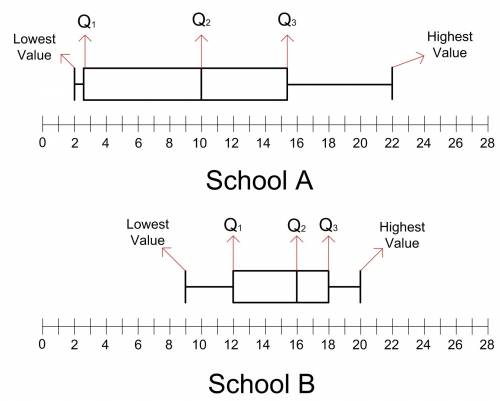
The following table shows the number of hours some students in two universities spend reading each week: school a 7 2 3 10 17 14 10 22 2 school b 9 10 16 18 20 15 17 18 14 part a: create a five-number summary and calculate the interquartile range for the two sets of data. (6 points) part b: are the box plots symmetric? justify your answer. (4 points)

Answers: 1
 ,
,  , and
, and  for each schools is given in the first picture below.
  is the lower quartile
 is the upper quartile
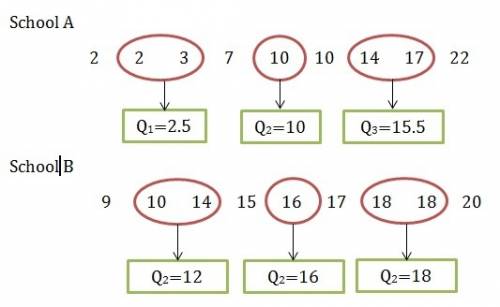
Another question on Mathematics
Mathematics, 21.06.2019 14:30
Fiona and her friends are playing a game by guessing where a coin will land when it is randomly dropped inside the square shown below. fiona guesses that the coin is likely to land in the blue area. which explains whether or not fiona is correct and why?
Answers: 1
Mathematics, 21.06.2019 21:00
Mr. thompson is on a diet. he currently weighs 260 pounds. he loses 4 pounds per month. what part of the story makes the relationship not proportional?
Answers: 3
Mathematics, 21.06.2019 22:00
After a dreary day of rain, the sun peeks through the clouds and a rainbow forms. you notice the rainbow is the shape of a parabola. the equation for this parabola is y = -x2 + 36. graph of a parabola opening down at the vertex 0 comma 36 crossing the x–axis at negative 6 comma 0 and 6 comma 0. in the distance, an airplane is taking off. as it ascends during take-off, it makes a slanted line that cuts through the rainbow at two points. create a table of at least four values for the function that includes two points of intersection between the airplane and the rainbow. analyze the two functions. answer the following reflection questions in complete sentences. what is the domain and range of the rainbow? explain what the domain and range represent. do all of the values make sense in this situation? why or why not? what are the x- and y-intercepts of the rainbow? explain what each intercept represents. is the linear function you created with your table positive or negative? explain. what are the solutions or solution to the system of equations created? explain what it or they represent. create your own piecewise function with at least two functions. explain, using complete sentences, the steps for graphing the function. graph the function by hand or using a graphing software of your choice (remember to submit the graph).
Answers: 2
Mathematics, 21.06.2019 23:10
The input to the function is x and the output is y. write the function such that x can be a vector (use element-by-element operations). a) use the function to calculate y(-1.5) and y(5). b) use the function to make a plot of the function y(x) for -2 ≤ x ≤ 6.
Answers: 1
You know the right answer?
The following table shows the number of hours some students in two universities spend reading each w...
Questions

Chemistry, 19.01.2021 22:00
Mathematics, 19.01.2021 22:00

English, 19.01.2021 22:00


German, 19.01.2021 22:00

Spanish, 19.01.2021 22:00
Mathematics, 19.01.2021 22:00
Mathematics, 19.01.2021 22:00


Computers and Technology, 19.01.2021 22:00
Physics, 19.01.2021 22:00


