this is my last question and i've been waiting 40 minutes
the graph below shows the heig...

Mathematics, 19.10.2019 14:30 dexy8683
this is my last question and i've been waiting 40 minutes
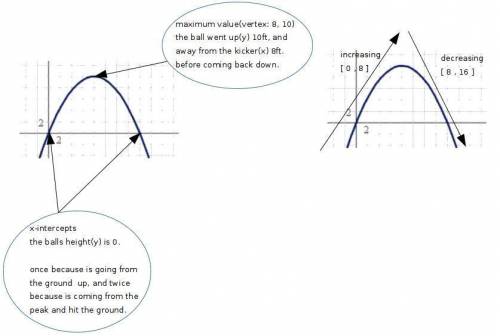
the graph below shows the height of a kicked soccer ball f(x), in feet, depending on the distance from the kicker x, in feet:
graph of quadratic function f(x) having x intercepts at ordered pairs (0, 0) and (16, 0). the vertex is at (8, 10).
part a: what do the x-intercepts and maximum value of the graph represent? what are the intervals where the function is increasing and decreasing, and what do they represent about the distance and height?
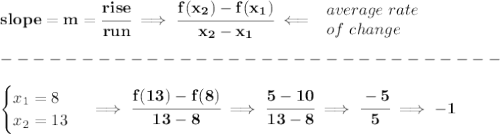
part b: what is an approximate average rate of change of the graph from x = 8 to x = 13, and what does this rate represent?

Answers: 3
Another question on Mathematics
Mathematics, 21.06.2019 15:00
(urgent ) use pi 3.14 to estimate the circumference of the circle to the nearest hundredth middle is 4in (urgent )
Answers: 1
Mathematics, 21.06.2019 16:00
Given a circle with measures of (c, d, and r) and a circle with measures of (c', d', and r'), what is d if c c' = 12 and d' = 0.50? a) 3 b) 6 c) 12 d) 24
Answers: 2
Mathematics, 21.06.2019 16:00
The graph shows the function f(x) = (2.5)x was horizontally translated left by a value of h to get the function g(x) = (2.5)x–h.
Answers: 1
Mathematics, 21.06.2019 19:40
The weights of broilers (commercially raised chickens) are approximately normally distributed with mean 1387 grams and standard deviation 161 grams. what is the probability that a randomly selected broiler weighs more than 1,425 grams?
Answers: 2
You know the right answer?
Questions


English, 09.09.2021 22:00
Mathematics, 09.09.2021 22:00
History, 09.09.2021 22:00

Geography, 09.09.2021 22:00
History, 09.09.2021 22:00
Mathematics, 09.09.2021 22:00
English, 09.09.2021 22:00


History, 09.09.2021 22:00

Arts, 09.09.2021 22:00


