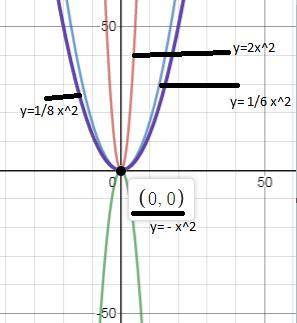
The graph of 2x^2 is narrowest .
Step-by-step explanation:
A).y=2x^2
When plot the graph for y=2x^2
The graph of y=2x^2 is parabola and along positive y-axis.The graph passing through origin .We can see
Put x=0 Then we get
y=0
Hence, the parabola passing through origin.
When we put x=1 then we get
y=
Put x=2 we get
y=8
Put x=3 then we get
y=18
Hence, we can see as the value of x increases then the value of y increases very sharply.
B).y=
The equation is also a equation of parabola
The parabola along positive y-axis.
Put x= 0 then we get
y=0
Hence, the parabola passing through the origin.
Put x=1 then we get
y= 
Put x=2 then we get
y=
Put x= 3 then we get
y= 1.5
Hence, we can when x increases then value of y increases slowly in comparison to x.
C). y=
The given equation is also a equation of parabola and along negative y- axis .
Putx=0 then we get
y=0
Hence, the parabola passing through the origin.
Put x=1 then we get
y= -1
Put x=2 then we get
y=-4
Put x=3 then we get
y=-9
Hence , value of y increases in direction of negtaive y-axis sharply in comparison to x increases .
D). y=
The given equation is parabola and passing and along positive y- axis .
Put x=0 then we get
y=0
Hence, the equation of parabola passing through the origin.
Put x=1 then we get
y=
Put x= 2 then we get
y= 
Put x=3 then we get
y= 1.125
Hence , we can see that value of y increases very slowly in comparison to x increases.
Hence, we can see that quadratic equation y=2x^2 has narrowest graph.