
Mathematics, 05.10.2019 19:00 cavapoo
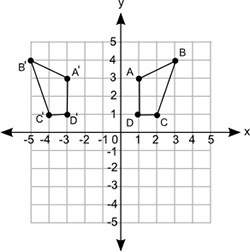
Which of the following sequences of transformations is used to obtain figure a prime b prime c prime d prime from figure abcd?
a /reflection about the x-axis followed by a translation to the right by 2 units
b/ reflection about the y-axis followed by a translation to the left by 2 units
c/ counterclockwise rotation by 90 degrees about the origin followed by a
translation to the right by 2 units
d/ counterclockwise rotation by 90 degrees about the origin followed by a translation to the left by 2 units

Answers: 2
Another question on Mathematics
Mathematics, 21.06.2019 14:30
The minimum wage in washington has been increasing over the last ten years. years 2000 2001 2002 2003 2004 2005 2006 2007 2008 2009 2010 washington state minimum wage $6.50 $6.72 $6.90 $7.01 $7.16 $7.35 $7.63 $7.93 $8.07 $8.55 $8.55 a) find the linear regression equation for the minimum wage in washington using this data ( x 0 in 2000). round to the thousandths. b) what is the slope? specifically, what does the slope represent in the real world context? c) what is the y-intercept? specifically, what does the y-intercept represent in the real world context? d) write your equation as a function of x. e) if you do not earn a college degree and you are earning minimum wage in 2020, what do you predict you will be earning per hour with the linear regression equation? f) if the trend continues, when will the minimum wage be $15 an hour? 3. why are your answers to #1d and #2a above different? which do you think is more accurate (#1 or #2) and why
Answers: 1
Mathematics, 21.06.2019 17:30
Lems1. the following data set represents the scores on intelligence quotient(iq) examinations of 40 sixth-grade students at a particular school: 114, 122, 103, 118, 99, 105, 134, 125, 117, 106, 109, 104, 111, 127,133, 111, 117, 103, 120, 98, 100, 130, 141, 119, 128, 106, 109, 115,113, 121, 100, 130, 125, 117, 119, 113, 104, 108, 110, 102(a) present this data set in a frequency histogram.(b) which class interval contains the greatest number of data values? (c) is there a roughly equal number of data in each class interval? (d) does the histogram appear to be approximately symmetric? if so,about which interval is it approximately symmetric?
Answers: 3
Mathematics, 21.06.2019 19:00
What is the factored form of the following expressions? d^2 – 13d + 36
Answers: 2
You know the right answer?
Which of the following sequences of transformations is used to obtain figure a prime b prime c prime...
Questions
Mathematics, 02.02.2021 22:30
Mathematics, 02.02.2021 22:30

History, 02.02.2021 22:30

Spanish, 02.02.2021 22:30

Law, 02.02.2021 22:30
Mathematics, 02.02.2021 22:30
Mathematics, 02.02.2021 22:30

Spanish, 02.02.2021 22:30


Arts, 02.02.2021 22:30
Arts, 02.02.2021 22:30

Computers and Technology, 02.02.2021 22:30
History, 02.02.2021 22:30
Computers and Technology, 02.02.2021 22:30
Mathematics, 02.02.2021 22:30


