subject
Mathematics, 30.01.2020 17:55 rbajaj9818

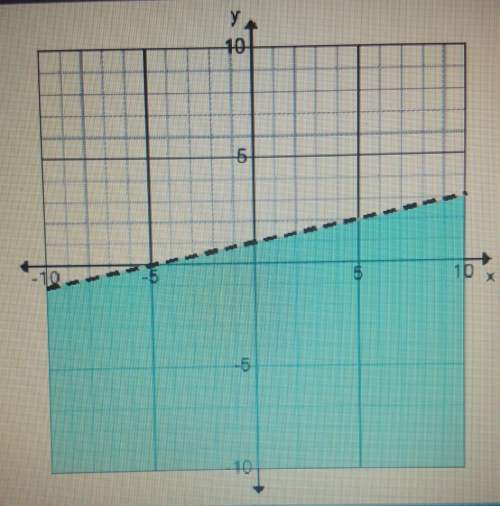
What inequality does the graph represent?

a) y > 1/5x - 1
b) y < 5x - 1
c) y < 1/5x + 1
d) y < -5x - 1


What inequality does the graph represent? a) y &gt; 1/5x - 1b) y &lt; 5x - 1

ansver
Answers: 3

Another question on Mathematics

question
Mathematics, 21.06.2019 15:40
36 inches/second = yards/minute how many yards?
Answers: 1
question
Mathematics, 21.06.2019 19:00
Rob spent 25%, percent more time on his research project than he had planned. he spent an extra h hours on the project. which of the following expressions could represent the number of hours rob actually spent on the project? two answers
Answers: 1
question
Mathematics, 21.06.2019 22:20
Select the correct answer from each drop-down menu. the table shows the annual sales revenue for different types of automobiles from three automobile manufacturers. sales revenue (millions of dollars) suv sedan truck marginal total b & b motors 22 15 9 46 pluto cars 25 27 10 62 panther motors 26 34 12 72 marginal total 73 76 31 180 the company with the highest percentage of sales revenue from sedans is . of the annual sales revenue from suvs, the relative frequency of pluto cars is .
Answers: 1
question
Mathematics, 21.06.2019 22:30
Ibeg you to me 20. a reaction produces 4.93 l of oxygen, but was supposed to produce 1 mol of oxygen. what is the percent yield?
Answers: 3
You know the right answer?
What inequality does the graph represent?

a) y > 1/5x - 1
b) y < 5x - 1
Questions
Questions on the website: 13722360