
Mathematics, 20.04.2021 21:30 bubl6010
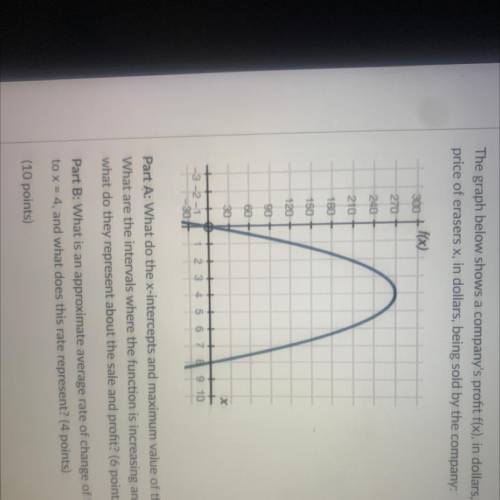
The graph below shows a company's profit f(x), in dollars, depending on the
price of erasers x, in dollars, being sold by the company:
300 + f(x)
270
240
210
180
150
120
90
60 +
30
Part A: What do the x-intercepts and maximum value of the graph represent?
What are the intervals where the function is increasing and decreasing, and
what do they represent about the sale and profit? (6 points)
Part B: What is an approximate average rate of change of the graph from x = 1
to x = 4, and what does this rate represent? (4 points)
(10 points)

Answers: 2
Another question on Mathematics
Mathematics, 21.06.2019 19:30
Awater holding tank measures 105 m long, 50 m wide, and 8 m deep. traces of mercury have been found in the tank, with a concen- tration of 60 mg/l. what is the total mass of mercury in the tank? answer in units of kg.
Answers: 1
Mathematics, 21.06.2019 20:00
The rectangle shown has a perimeter of 108 cm and the given area. its length is 6 more than five times its width. write and solve a system of equations to find the dimensions of the rectangle.
Answers: 3
Mathematics, 22.06.2019 00:00
Asequence has a common ratio of and f(5) = 81. which explicit formula represents the sequence? f(x) = 24 f(x) = 16 f(x) = 24 f(x) = 16
Answers: 1
You know the right answer?
The graph below shows a company's profit f(x), in dollars, depending on the
price of erasers x, in...
Questions
Mathematics, 06.10.2020 23:01

Mathematics, 06.10.2020 23:01


Biology, 06.10.2020 23:01
History, 06.10.2020 23:01
History, 06.10.2020 23:01


