
Mathematics, 25.04.2021 21:30 sonnyboi2305
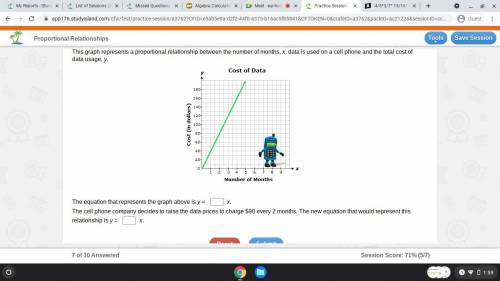
This graph represents a proportional relationship between the number of months, x, data is used on a cell phone and the total cost of data usage, y.
The equation that represents the graph above is y =
x.
The cell phone company decides to raise the data prices to charge $90 every 2 months. The new equation that would represent this relationship is y =
x.

Answers: 3
Another question on Mathematics
Mathematics, 21.06.2019 17:30
Gregory draws a scale drawing of his room. the scale that he uses is 1 cm : 4 ft. on his drawing, the room is 3 centimeters long. which equation can be used to find the actual length of gregory's room?
Answers: 1
Mathematics, 21.06.2019 20:40
What are the values of each variable in the diagram below?
Answers: 2
Mathematics, 22.06.2019 00:30
Three friends are comparing the prices of various packages of golf balls at a sporting goods store. hector finds a package of 6 golf balls that costs $4.50.
Answers: 3
Mathematics, 22.06.2019 01:30
Write the equation of the circle centered at (10,-2) with radius 2.
Answers: 2
You know the right answer?
This graph represents a proportional relationship between the number of months, x, data is used on a...
Questions

SAT, 05.01.2022 06:30

English, 05.01.2022 06:30
Mathematics, 05.01.2022 06:30
Mathematics, 05.01.2022 06:30


Biology, 05.01.2022 06:40

SAT, 05.01.2022 06:40

Arts, 05.01.2022 06:40
Business, 05.01.2022 06:40

Advanced Placement (AP), 05.01.2022 06:40

Social Studies, 05.01.2022 06:40
Social Studies, 05.01.2022 06:40


