
Mathematics, 26.04.2021 15:10 Haddy7202
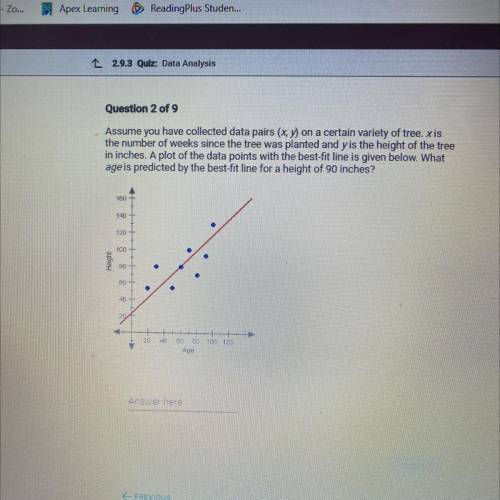
Assume you have collected data pairs (x, y) on a certain variety of tree. xis
the number of weeks since the tree was planted and y is the height of the tree
in inches. A plot of the data points with the best-fit line is given below. What
age is predicted by the best-fit line for a height of 90 inches?
180
140
120
100
Height
50
B0
40
ZO
20
40
103 120
Age

Answers: 2
Another question on Mathematics
Mathematics, 21.06.2019 13:30
34 cup. a serving of vegetable soup is 23 cup. the restaurant sold 20 servings of chicken noodle soup and 18 servings of vegetable soup. how many more cups of chicken noodle soup did they sell than cups of vegetable soup?
Answers: 2
Mathematics, 21.06.2019 18:00
1. what expression would be the same as 6x+x+0 2. find the prime factorization of 60 3. write the expression for 6 + x in words.
Answers: 3
Mathematics, 21.06.2019 18:30
What can each term of the equation be multiplied by to eliminate the fractions before solving? x – + 2x = + x 2 6 10 12
Answers: 1
Mathematics, 21.06.2019 21:20
In 2009, there were 1570 bears in a wildlife refuge. in 2010, the population had increased to approximately 1884 bears. if this trend continues and the bear population is increasing exponentially, how many bears will there be in 2018?
Answers: 2
You know the right answer?
Assume you have collected data pairs (x, y) on a certain variety of tree. xis
the number of weeks...
Questions

Health, 10.07.2019 07:30

Mathematics, 10.07.2019 07:30
Mathematics, 10.07.2019 07:30
Mathematics, 10.07.2019 07:30

Social Studies, 10.07.2019 07:30


Chemistry, 10.07.2019 07:30

Mathematics, 10.07.2019 07:30
Physics, 10.07.2019 07:30
Chemistry, 10.07.2019 07:30


