10.
The lines graphed below show the amounts of water in two tanks as they were being
filled...

Mathematics, 27.04.2021 19:00 purplefish53
10.
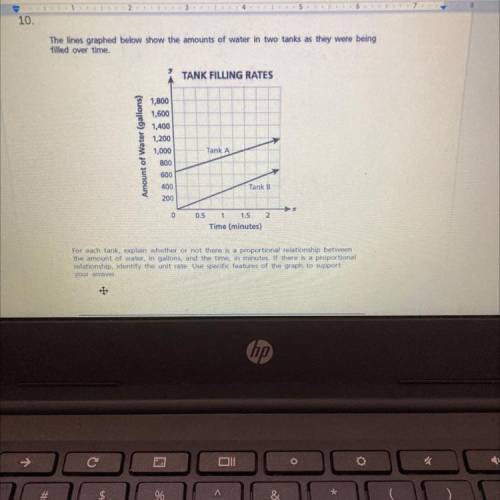
The lines graphed below show the amounts of water in two tanks as they were being
filled over time.
TANK FILLING RATES
+
Amount of Water (gallons)
1,800
1,600
1,400
1,200
1,000
800
600
400
200
Tank A
Tank B
0
0.5
1 1.5 2
Time (minutes)
For each tank, explain whether or not there is a proportional relationship between
the amount of water, in gallons, and the time, in minutes. If there is a proportional
relationship, identify the unit rate. Use specific features of the graph to support
your answer
hp

Answers: 1
Another question on Mathematics
Mathematics, 21.06.2019 18:00
Ageologist had two rocks on a scale that weighed 4.6 kilograms together.rock a was 0.5 of the total weight.how much did rock a weigh?
Answers: 1
Mathematics, 22.06.2019 02:10
The price of one share of a company’s stock declined $13.89 every day for 2.5 days what was the stocks total decline in price
Answers: 1
Mathematics, 22.06.2019 02:50
Asap! i need this done today and i really don’t understand it. some one ! will mark
Answers: 1
Mathematics, 22.06.2019 05:30
Find the area of the trapezoid a. 150 ft^2 b. 300 ft^2 c. 45 ft^2 d. 75 ft^2
Answers: 1
You know the right answer?
Questions


