
Mathematics, 29.04.2021 22:30 denaemarie02
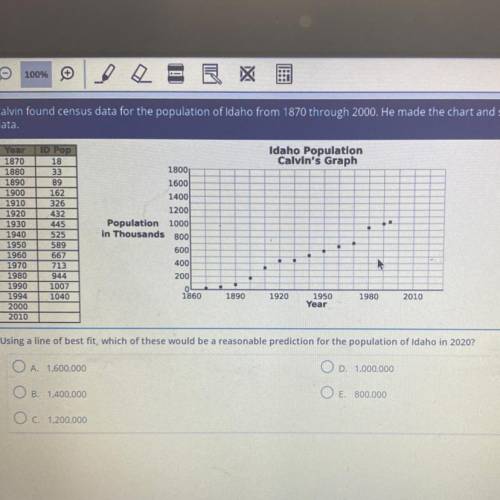
Calvin found census data for the population of Idaho from 1870 through 2000. He made the chart and scatter plot using this
data.
Idaho Population
Calvin's Graph
Yaar
1870
1880
1890
1900
1910
1920
1930
1940
1950
1960
1970
1980
1990
1994
2000
2010
TID Pop
18
33
89
162
326
432
445
525
589
667
713
944
1007
1040
1800
1600)
1400
1200
Population 1000
in Thousands 800
600
400
200
OL
1860
1890
1920
1950
Year
1980
2010
Using a line of best fit, which of these would be a reasonable prediction for the population of Idaho in 2020?
O A 1.600.000
O D. 1,000,000
O B. 1,400,000
O E. 800.000
O c. 1.200.000

Answers: 2
Another question on Mathematics
Mathematics, 21.06.2019 16:00
What value of x will make the triangles similar by the sss similarity theorem?
Answers: 3
Mathematics, 21.06.2019 18:30
Use the four functions below for this question. compare and contrast these four functions using complete sentences focus on the slope and y- intercept first, and then on any additional properties of each function
Answers: 3
Mathematics, 21.06.2019 19:30
1. find the area of the unshaded square 2. find the area of the large square 3. what is the area of the frame represented by the shaded region show
Answers: 1
Mathematics, 21.06.2019 20:20
Aline passes through (1,-5) and(-3,7) write an equation for the line in point slope form rewrite the equation in slope intercept form
Answers: 1
You know the right answer?
Calvin found census data for the population of Idaho from 1870 through 2000. He made the chart and s...
Questions

Mathematics, 13.08.2020 06:01

History, 13.08.2020 06:01
English, 13.08.2020 06:01

History, 13.08.2020 06:01
Mathematics, 13.08.2020 06:01


Mathematics, 13.08.2020 06:01
History, 13.08.2020 06:01
Mathematics, 13.08.2020 06:01


