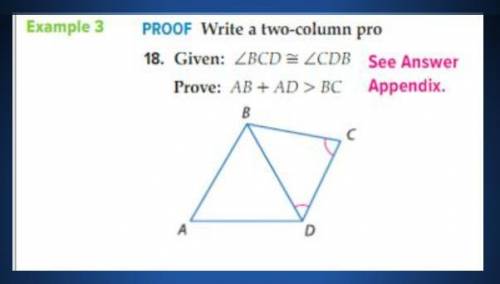
Write a two-column pro
...

Answers: 3
Another question on Mathematics

Mathematics, 21.06.2019 14:50
About 60% of the normal humanbeing's body weight is composed ofwater. how much of a 125 poundperson is water weight? f 72 pounds h 76 poundsg 75 pounds i 80 pounds
Answers: 3
Mathematics, 21.06.2019 15:30
What is the measure of angle z in this figure? enter your answer in the box. z = ° two intersection lines. all four angles formed by the intersecting lines are labeled. clockwise, the angles are labeled 43 degrees, x degrees, y degrees, and z degrees.
Answers: 3
Mathematics, 21.06.2019 16:00
Part one: measurements 1. measure your own height and arm span (from finger-tip to finger-tip) in inches. you will likely need some from a parent, guardian, or sibling to get accurate measurements. record your measurements on the "data record" document. use the "data record" to you complete part two of this project. name relationship to student x height in inches y arm span in inches archie dad 72 72 ginelle mom 65 66 sarah sister 64 65 meleah sister 66 3/4 67 rachel sister 53 1/2 53 emily auntie 66 1/2 66 hannah myself 66 1/2 69 part two: representation of data with plots 1. using graphing software of your choice, create a scatter plot of your data. predict the line of best fit, and sketch it on your graph. part three: the line of best fit include your scatter plot and the answers to the following questions in your word processing document 1. 1. which variable did you plot on the x-axis, and which variable did you plot on the y-axis? explain why you assigned the variables in that way. 2. write the equation of the line of best fit using the slope-intercept formula $y = mx + b$. show all your work, including the points used to determine the slope and how the equation was determined. 3. what does the slope of the line represent within the context of your graph? what does the y-intercept represent? 5. use the line of best fit to you to describe the data correlation.
Answers: 2
Mathematics, 21.06.2019 18:00
Suppose you are going to graph the data in the table. minutes temperature (°c) 0 -2 1 1 2 3 3 4 4 5 5 -4 6 2 7 -3 what data should be represented on each axis, and what should the axis increments be? x-axis: minutes in increments of 1; y-axis: temperature in increments of 5 x-axis: temperature in increments of 5; y-axis: minutes in increments of 1 x-axis: minutes in increments of 1; y-axis: temperature in increments of 1 x-axis: temperature in increments of 1; y-axis: minutes in increments of 5
Answers: 2
You know the right answer?
Questions
Mathematics, 04.02.2021 21:20

History, 04.02.2021 21:20
Mathematics, 04.02.2021 21:20
Mathematics, 04.02.2021 21:20
Mathematics, 04.02.2021 21:20


Mathematics, 04.02.2021 21:20

Social Studies, 04.02.2021 21:20
English, 04.02.2021 21:20

Computers and Technology, 04.02.2021 21:20


