
Mathematics, 04.05.2021 02:50 emmawytko
Help Please, I just need these questions. Show work as well please.
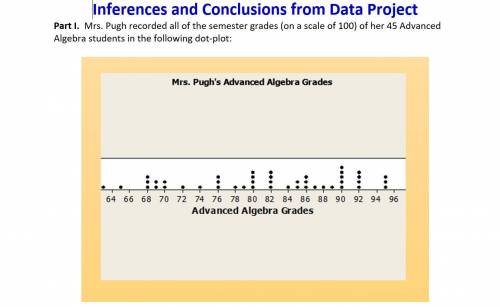
He first took a random sample of five students and calculated the average of the five students.
Simulate what the principal did below:
Seed your calculator by typing “1” “STO” “rand” on your calculator. To make sure you did this correctly, type randint(1,45) and you should get a number between 1 and 45 (it was found from a random integer generator).
9. Simulate what the principal did by typing randint(1,45,5) to get 5 numbers. What are the
numbers?
10. Locate these values on the dot-plot. 1 corresponds to the lowest test score, and 45 corresponds to the highest test score. What are the associated test scores from the numbers generated in #9?
11. Find the average of these 5 test scores.
12. Is this sample mean the same as the population mean?
13. Why or why not?
14. What could the principal communicate to the parent that complained?

Answers: 3
Another question on Mathematics
Mathematics, 21.06.2019 19:00
2pointswhich of the following appear in the diagram below? check all that apply.d a. zcdeов. сеo c. aéo d. zdce
Answers: 1
Mathematics, 21.06.2019 23:30
Segment wx is shown explain how you would construct a perpendicular bisector of wx using a compass and a straightedge
Answers: 3
Mathematics, 22.06.2019 01:00
The weight of 46 new patients of a clinic from the year 2018 are recorded and listed below. construct a frequency distribution, using 7 classes. then, draw a histogram, a frequency polygon, and an ogive for the data, using the relative information from the frequency table for each of the graphs. describe the shape of the histogram. data set: 130 192 145 97 100 122 210 132 107 95 210 128 193 208 118 196 130 178 187 240 90 126 98 194 115 212 110 225 187 133 220 218 110 104 201 120 183 124 261 270 108 160 203 210 191 180 1) complete the frequency distribution table below (add as many rows as needed): - class limits - class boundaries - midpoint - frequency - cumulative frequency 2) histogram 3) frequency polygon 4) ogive
Answers: 1
You know the right answer?
Help Please, I just need these questions. Show work as well please.
He first took a random sample...
Questions
Mathematics, 06.05.2020 20:11


History, 06.05.2020 20:11


Physics, 06.05.2020 20:11

French, 06.05.2020 20:11

Computers and Technology, 06.05.2020 20:11

English, 06.05.2020 20:11
History, 06.05.2020 20:11


