
Mathematics, 05.05.2021 17:20 weeman67161
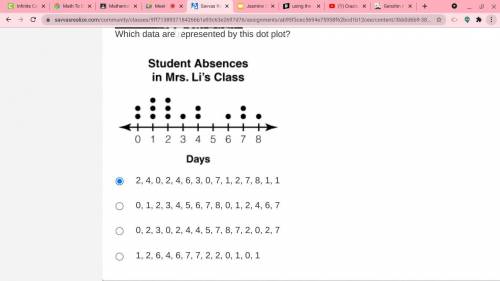
Which data are represented by this dot plot?
A dot plot titled student absences in Misses Lee's class. The dot plot goes from 0 to 8 and is labeled days. The data is as follows. 2 dots above 0, 3 dots above 1, 3 dots above 2, 1 dot above 3, 2 dots above 4, 0 dots above 5, 1 dot above 6, 2 dots above 7, and 1 dot above 8.
2, 4, 0, 2, 4, 6, 3, 0, 7, 1, 2, 7, 8, 1, 1
0, 1, 2, 3, 4, 5, 6, 7, 8, 0, 1, 2, 4, 6, 7
0, 2, 3, 0, 2, 4, 4, 5, 7, 8, 7, 2, 0, 2, 7
1, 2, 6, 4, 6, 7, 7, 2, 2, 0, 1, 0, 1

Answers: 1
Another question on Mathematics
Mathematics, 21.06.2019 19:10
The linear combination method is applied to a system of equations as shown. 4(.25x + .5y = 3.75) → x + 2y = 15 (4x – 8y = 12) → x – 2y = 3 2x = 18 what is the solution of the system of equations? (1,2) (3,9) (5,5) (9,3)
Answers: 1
Mathematics, 22.06.2019 00:20
The police chief wants to know if the city’s african americans feel that the police are doing a good job. identify the management problem (i.e dependent variable) and identify the independent variable.
Answers: 1
Mathematics, 22.06.2019 02:00
The table below shows the number of free throw shots attempted and the number of shots made for the five starting players on the basketball team during practice. each player's goal is to make 80% of her shots.
Answers: 1
You know the right answer?
Which data are represented by this dot plot?
A dot plot titled student absences in Misses Lee's cl...
Questions

English, 11.05.2021 18:30


Physics, 11.05.2021 18:30
Mathematics, 11.05.2021 18:30

History, 11.05.2021 18:30
Mathematics, 11.05.2021 18:30

Chemistry, 11.05.2021 18:30
Mathematics, 11.05.2021 18:30


