
Mathematics, 07.05.2021 20:20 ashleyuchiha123
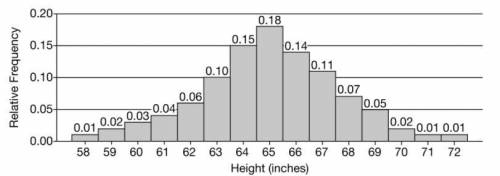
The following histogram shows the relative frequencies of the heights, recorded to the nearest inch, of a population of women. The mean of the population is 64.97 inches, and the standard deviation is 2.66 inches.
One woman from the population will be selected at random.
Question 3
(c) The histogram displays a discrete probability model for height. However, height is often considered a continuous variable that follows a normal model. Consider a normal model that uses the mean and standard deviation of the population of women as its parameters.
(i) Use the normal model and the relationship between area and relative frequency to find the probability that the randomly selected woman will have a height of at least 67 inches. Show your work.
(ii) Does your answer in part (c-i) match your answer in part (a) ? If not, give a reason for why the answers might be different.
Question 4
(d) Let the random variable H represent the height of a woman in the population. P(H<60) represents the probability of randomly selecting a woman with height less than 60 inches. Based on the information given, the probability can be found using either the discrete model or the normal model.
(i) Give an example of a probability of H that can be found using the discrete model but not the normal model. Explain why.
(ii) Give an example of a probability of H that can be found using the normal model but not the discrete model. Explain why.

Answers: 1
Another question on Mathematics
Mathematics, 21.06.2019 13:00
The number of electoral votes each state is assigned is determined by the size of its population every ten years. the chart shows the number of electoral votes california was assigned each decade of the past century. what is the 3rd quartile of the data?
Answers: 1
Mathematics, 21.06.2019 21:20
Paul’s car is 18 feet long. he is making a model of his car that is 1/6 the actual size. what is the length of the model?
Answers: 1
Mathematics, 21.06.2019 22:00
In δabc, m∠acb = 90°, cd ⊥ ab and m∠acd = 45°. find: a find cd, if bc = 3 in
Answers: 1
Mathematics, 21.06.2019 23:30
Given: ad¯¯¯¯¯ is an altitude. prove: ab2+ac2=cb2 right triangle a b c with right angle a. point d lies on side b c and segment a d is drawn. angle a d c is a right angle. drag and drop a reason into each box to correctly complete the two-column proof. statement reason ad¯¯¯¯¯ is an altitude, and ∠bac is a right angle. given ∠adb and ∠adc are right angles. definition of altitude ∠bac≅∠bda ? ∠bac≅∠adc ? ∠b≅∠b ? ∠c≅∠c reflexive property of congruence △abc∼△dba ? △abc∼△dac aa similarity postulate abbd=cbab ? ab2=(cb)(bd) cross multiply and simplify. acdc=cbac polygon similarity postulate ac2=(cb)(dc) cross multiply and simplify. ab2+ac2=ab2+(cb)(dc) addition property of equality ab2+ac2=(cb)(bd)+(cb)(dc) substitution property of equality ab2+ac2=(cb)(bd+dc) ? bd+dc=cb segment addition postulate ab2+ac2=cb2 substitution property of equality
Answers: 1
You know the right answer?
The following histogram shows the relative frequencies of the heights, recorded to the nearest inch,...
Questions

Social Studies, 22.06.2019 10:50

History, 22.06.2019 10:50


Biology, 22.06.2019 11:00


History, 22.06.2019 11:00
Mathematics, 22.06.2019 11:00

Computers and Technology, 22.06.2019 11:00


