Question Help ASAP
Consider the grouped sample data to the right.
a) Calculate the approxima...

Mathematics, 08.05.2021 17:50 brandyjune9546
Question Help ASAP
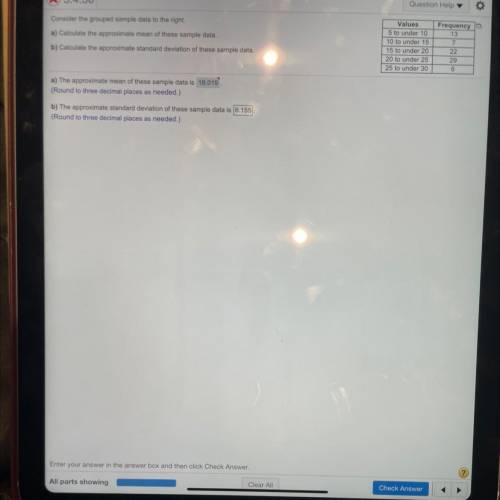
Consider the grouped sample data to the right.
a) Calculate the approximate mean of these sample data.
b) Calculate the approximate standard deviation of these sample data.
Values
5 to under 10
10 to under 15
15 to u
o under
20
20 to under 25
25 to under 30
Frequency
13
7
22
29
6
a) The approximate mean of these sample data is 18.019
(Round to three decimal places as needed.)
b) The approximate standard deviation of these sample data is 6.155
(Round to three decimal places as needed.)

Answers: 2
Another question on Mathematics
Mathematics, 21.06.2019 12:30
In djkl, side jk measures 10.6 inches, side kl measures 7 inches, and side jl measures 5 inches. based on the information that is provided, which could be a correct set of angle measures for these sides? angle j = 23.2°, angle k = 33.5°, angle l = 23.2° angle j = 23.2°, angle k = 33.5°, angle l = 123.2° angle j = 123.2°, angle k = 23.2°, angle l = 33.5° angle j = 33.5°, angle k = 23.2°, angle l = 123.2°
Answers: 1
Mathematics, 21.06.2019 20:30
A. plot the data for the functions f(x) and g(x) on a grid and connect the points. x -2 -1 0 1 2 f(x) 1/9 1/3 1 3 9 x -2 -1 0 1 2 g(x) -4 -2 0 2 4 b. which function could be described as exponential and which as linear? explain. c. if the functions continue with the same pattern, will the function values ever be equal? if so, give estimates for the value of x that will make the function values equals. if not, explain why the function values will never be equal.
Answers: 3
Mathematics, 21.06.2019 21:00
Choose the equation below that represents the line that passes through the point (2, 4) and has a slope of 3. a) y − 4 = 3(x − 2) b) y − 2 = 3(x − 4) c) y + 4 = 3(x + 2) d) y + 2 = 3(x + 4)
Answers: 1
Mathematics, 21.06.2019 23:00
Type the correct answer in each box. use numerals instead of words. the average number of subscribers to an online magazine each year from 2010 to 2015 is given in the table below. the average number of subscribers to the online magazine in 2010 was the percent increase in the average number of subscribers in 2011 to the average number of subscribers in 2012 was %. the maximum average number of subscribers to the online magazine in the years shown was
Answers: 2
You know the right answer?
Questions


Biology, 11.10.2020 02:01

Advanced Placement (AP), 11.10.2020 02:01

English, 11.10.2020 02:01
Mathematics, 11.10.2020 02:01
Mathematics, 11.10.2020 02:01

History, 11.10.2020 02:01
Mathematics, 11.10.2020 02:01

Chemistry, 11.10.2020 02:01
Engineering, 11.10.2020 02:01


Physics, 11.10.2020 02:01


