
Mathematics, 12.05.2021 15:20 Spencerg325
Please actually answer. If you don't, I'm gonna report your answer.
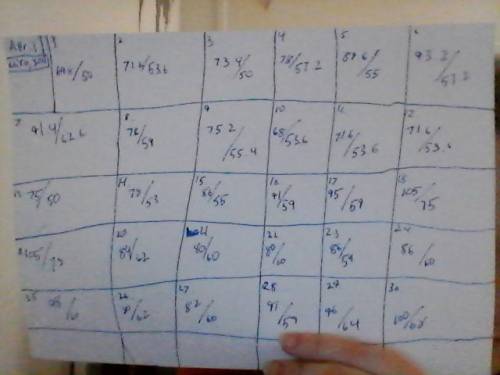
I. Construct a chart like the sample in the discussion. Try to have no fewer than five class intervals. "Class interval" refers to the number of categories a type of data could fall into (e. g., 70-79 degrees, 80-89 degrees, etc.).
II. Compute the probability that an observation picked at random will be a Saturday observation.
III. Repeat number two for the remaining days of the week.
IV. Use the chart in the discussion to answer these questions:
What is the probability a day in the 70s is a Monday?
Which set forms the intersection of Tuesdays in the 80s?
What is the probability an observation picked at random is both a Sunday and more than 90 degrees?
V. Construct a histogram to display the temperature frequencies for the month. (Use temperature class intervals and totals.)
VI. Pretend that you are working for the tourist bureau for your city. Which measure of central tendency (mean, median, mode) would you use in advertising to attract tourists. Justify your answer.
Complete tasks I-VI on your own paper. Upload your document.
(There is a picture for step one, so no need to collect any new data. just make sure to base the rest on that)

Answers: 3
Another question on Mathematics
Mathematics, 21.06.2019 14:40
Iam trying to solve a linear equation for the shoe size of someone 84" tall taking into consideration example 1 is 69" tall with a shoe size of 9 and example 2 is 72 inches tall with a shoe size of 11. i understand that the equation should be y=mx+b and that on the graph the answer is (3,2) but i just don't understand how to create the equation to solve for 84-inches and 60-inches tall questions. after two days, i need .
Answers: 2
Mathematics, 21.06.2019 17:00
Amanager recorded the number of bicycles sold by his company each quarter. his projected sales after t years is given by the expression below. which of the following statements best describes the expression? a. the initial sales of 575 bicycles increases at the rate of 4% over 4 quarters. b. the initial sales of 575 bicycles increases at the rate of 18% over 4 years. c. the initial sales of 575 bicycles increases at the rate of 4% over t quarters. d. the initial sales of 575 bicycles increases at the rate of 18% over t years.
Answers: 1
Mathematics, 21.06.2019 18:00
What set does not contain -3 the set of all real numbers the set of all integers the set of all whole numbers the set of all rational numbers
Answers: 1
Mathematics, 21.06.2019 18:10
Abc will undergo two transformations to give aa'b'c' which pair of transformations will give a different image of aabc if the order of the transformations is reversed? a. a rotation 90' counterclockwise about the origin followed by a reflection across the y-axis b a translation 5 units down followed by a translation 4 units to the right c. a reflection across the x-axis followed by a reflection across the y-axis a rotation 180'clockwise about the ongin followed by a reflection across the y-axis reset next 2 omentum all rights reserved o atk me anything o o e
Answers: 1
You know the right answer?
Please actually answer. If you don't, I'm gonna report your answer.
I. Construct a chart like the s...
Questions

Mathematics, 20.06.2019 18:04
Mathematics, 20.06.2019 18:04

History, 20.06.2019 18:04

Physics, 20.06.2019 18:04
English, 20.06.2019 18:04

English, 20.06.2019 18:04

Mathematics, 20.06.2019 18:04
Mathematics, 20.06.2019 18:04
Social Studies, 20.06.2019 18:04


