
Mathematics, 13.05.2021 01:00 rbeltran24
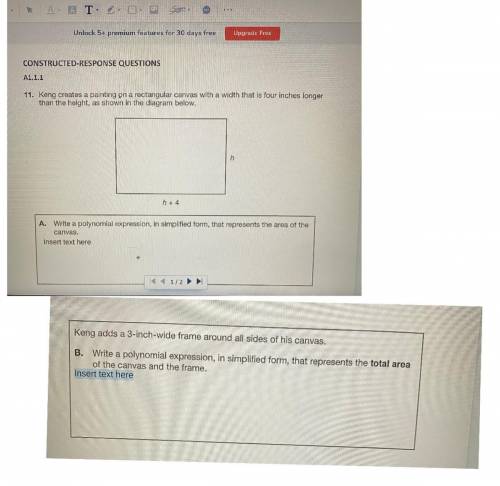
11. Keng creates a painting on a rectangular canvas with a width that is four inches longer
than the height, as shown in the diagram below.
L= h +4 and H = h
A. Write a polynomial expression, in simplified form, that represents the area of the
canvas.
Keng adds a 3-inch-wide frame around all sides of his canvas.
B. Write a polynomial expression, in simplified form, that represents the total area of the canvas and the frame.

Answers: 1
Another question on Mathematics
Mathematics, 21.06.2019 12:30
Are carpet coast $15 per square metre. the total delivery charge is $21 peter buys n squared metres of carpet what is the expression which represents the total cost in $
Answers: 1
Mathematics, 21.06.2019 16:00
Part one: measurements 1. measure your own height and arm span (from finger-tip to finger-tip) in inches. you will likely need some from a parent, guardian, or sibling to get accurate measurements. record your measurements on the "data record" document. use the "data record" to you complete part two of this project. name relationship to student x height in inches y arm span in inches archie dad 72 72 ginelle mom 65 66 sarah sister 64 65 meleah sister 66 3/4 67 rachel sister 53 1/2 53 emily auntie 66 1/2 66 hannah myself 66 1/2 69 part two: representation of data with plots 1. using graphing software of your choice, create a scatter plot of your data. predict the line of best fit, and sketch it on your graph. part three: the line of best fit include your scatter plot and the answers to the following questions in your word processing document 1. 1. which variable did you plot on the x-axis, and which variable did you plot on the y-axis? explain why you assigned the variables in that way. 2. write the equation of the line of best fit using the slope-intercept formula $y = mx + b$. show all your work, including the points used to determine the slope and how the equation was determined. 3. what does the slope of the line represent within the context of your graph? what does the y-intercept represent? 5. use the line of best fit to you to describe the data correlation.
Answers: 2
Mathematics, 21.06.2019 16:20
Find the slope of a line given the following two points
Answers: 1
Mathematics, 21.06.2019 17:40
The graph of y = ax^2 + bx + c is a parabola that opens up and has a vertex at (0, 5). what is the solution set of the related equation 0 = ax%2 + bx + c?
Answers: 2
You know the right answer?
11. Keng creates a painting on a rectangular canvas with a width that is four inches longer
than th...
Questions

Arts, 12.11.2020 23:40

Mathematics, 12.11.2020 23:40

Computers and Technology, 12.11.2020 23:40

History, 12.11.2020 23:40
Mathematics, 12.11.2020 23:40

Chemistry, 12.11.2020 23:40
Mathematics, 12.11.2020 23:40

Mathematics, 12.11.2020 23:40
Mathematics, 12.11.2020 23:40
Mathematics, 12.11.2020 23:40
English, 12.11.2020 23:40
Mathematics, 12.11.2020 23:40

Biology, 12.11.2020 23:40


