
Mathematics, 14.05.2021 22:40 namirah0303
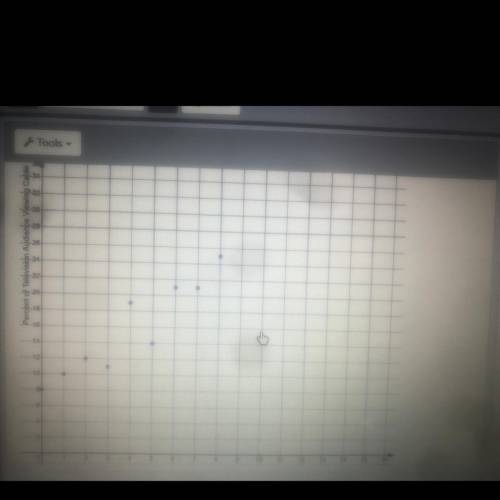
Statistics on the percent of the television viewing audience watching cable rather than the major networks have been kept since 1982. The scatter plot below represents results from 1982 to 1990 sketch a line that best fits
part b: using your graph from part A, write an equation to model the line best fit.
Part C: predict the percent of the television viewing audience watching cable in 1992. show your work with your equation from part B equation or from your graph in part A

Answers: 2
Another question on Mathematics
Mathematics, 21.06.2019 17:30
11. a particular type of cell doubles in number every hour. which function can be used to find the number of cells present at the end of h hours if there are initially 4 of these cells? a. n = 4 ()" b. n = 4(2)" c. n = 4 + (2)" din = 4 +"
Answers: 1
Mathematics, 21.06.2019 22:30
Which expressions equal 9 when x=4 and y=1/3 a. x2+6y b. 2x + 3y c. y2-21x d. 5 (x/2) -3y e. 3x-9y
Answers: 2
Mathematics, 21.06.2019 22:50
What is the ordered pair of m’ after point m (5, 6) is rotated 90° counterclockwise?
Answers: 2
Mathematics, 22.06.2019 00:00
Which of the following statements are true about the graph of f (x) = 1/4 coz ( x + π/3) - 1? select two of the following that apply.
Answers: 1
You know the right answer?
Statistics on the percent of the television viewing audience watching cable rather than the major ne...
Questions
Mathematics, 07.01.2021 19:00

Mathematics, 07.01.2021 19:00

Business, 07.01.2021 19:00

Physics, 07.01.2021 19:00

Mathematics, 07.01.2021 19:00
English, 07.01.2021 19:00

Social Studies, 07.01.2021 19:00

Computers and Technology, 07.01.2021 19:00
Mathematics, 07.01.2021 19:00
English, 07.01.2021 19:00
Social Studies, 07.01.2021 19:00

Mathematics, 07.01.2021 19:00
Mathematics, 07.01.2021 19:00


