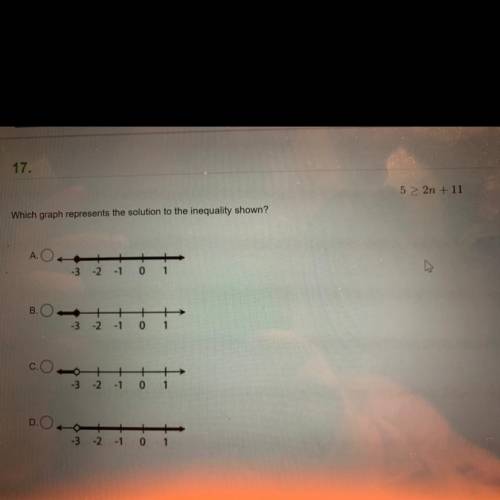
the answer would be d.
step-by-step explanation:
move all variables to the left side and all constants to the right side
(x−3)^2+(y−1)^2=16
this is the form of a circle. use this form to determine the center and radius of the circle.
( x − h ) 2 + ( y − k ) 2 = r 2
match the values in this circle to those of the standard form. the variable r represents the radius of the circle, h represents the x-offset from the origin, and k represents the y-offset from origin.
r = 4
h = 3
k = 1
the center of the circle is found at ( h , k ) .
center: ( 3 , 1 )
these values represent the important values for graphing and analyzing a circle.
center: ( 3 , 1 ).
radius: 4