
Mathematics, 20.05.2021 21:40 ManBun99
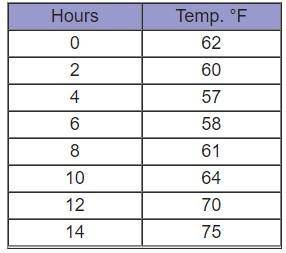
The temperature in degrees Fahrenheit was recorded every two hours starting at midnight on the first day of summer. The data is show in the table.
Which type of graph would best display the change in the temperatures throughout the day?
bar graph
line graph
line plot
stem and leaf plot

Answers: 3
Another question on Mathematics
Mathematics, 21.06.2019 15:20
At the newest animated movie, for every 9 children, there are 4 adults. there are a total of 39 children and adults at the movie.
Answers: 2
Mathematics, 22.06.2019 01:00
33 ! use the following data to determine the type of function (linear, quadratic, exponential) that best fits the data set. (1, 2) (5, 7) (9, 8) (3, 4) (4, 5) (2, 3)
Answers: 1
Mathematics, 22.06.2019 03:00
The perimeter of ? cde is 55 cm. a rhombus dmfn is inscribed in this triangle so that vertices m, f, and n lie on the sides cd , ce , and de respectively. find cd and de if cf=8 cm and ef=12 cm. the answer is not cd=20 and de=15. i have tried that one, it does not work.
Answers: 3
Mathematics, 22.06.2019 05:30
Which equation has a constant of proportionality equal to 9
Answers: 2
You know the right answer?
The temperature in degrees Fahrenheit was recorded every two hours starting at midnight on the first...
Questions

Chemistry, 04.12.2020 09:20

Health, 04.12.2020 09:20
Mathematics, 04.12.2020 09:20


Chemistry, 04.12.2020 09:20

English, 04.12.2020 09:20
Mathematics, 04.12.2020 09:20
Mathematics, 04.12.2020 09:20

Chemistry, 04.12.2020 09:20
Mathematics, 04.12.2020 09:20
Mathematics, 04.12.2020 09:20
Mathematics, 04.12.2020 09:20
Social Studies, 04.12.2020 09:20
Mathematics, 04.12.2020 09:20


