
Mathematics, 20.05.2021 23:00 trinityparker
Taking a test i don’t know anything about please help
In an Economics course, the correlation between the students' total score prior to the final exam and
their final exam score is r = 0.60. The pre-exam totals for all students in the course have mean 280
points and standard deviation 30 points. The final exam scores have mean 75 points and standard
deviation 8 points.
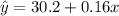
4. Find the equation of the least-squares regression line for predicting a final exam score from a
student's pre-exam total.
5.
Interpret the slope in context.
6.
Interpret the y-intercept in context.
7.
Calculate the fraction of variability, R?.
8.
Interpret R? in context.


Answers: 3
 where:

 ,
,  ,
,  ,
,  , and
, and  , therefore our slope,
  , is:
, is:

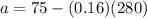
 and
and  to find the constant
  :
:


 , means that a certain proportion (or percentage) of the variance in the response variable can be explained by the explanatory variable. In context, this means that 36% of the variance in final exam scores can be explained by the pre-exam scores.
Another question on Mathematics
Mathematics, 21.06.2019 19:30
The amount spent on food and drink by 20 customers is shown below what is the modal amount spent ?
Answers: 1
Mathematics, 21.06.2019 19:30
Carlos spent 1 1/4 hours doing his math homework he spent 1/4 of his time practicing his multiplication facts how many hours to carlos been practicing his multiplication facts
Answers: 2
Mathematics, 21.06.2019 21:30
Name and describe the three most important measures of central tendency. choose the correct answer below. a. the mean, sample size, and mode are the most important measures of central tendency. the mean of a data set is the sum of the observations divided by the middle value in its ordered list. the sample size of a data set is the number of observations. the mode of a data set is its highest value in its ordered list. b. the sample size, median, and mode are the most important measures of central tendency. the sample size of a data set is the difference between the highest value and lowest value in its ordered list. the median of a data set is its most frequently occurring value. the mode of a data set is sum of the observations divided by the number of observations. c. the mean, median, and mode are the most important measures of central tendency. the mean of a data set is the product of the observations divided by the number of observations. the median of a data set is the lowest value in its ordered list. the mode of a data set is its least frequently occurring value. d. the mean, median, and mode are the most important measures of central tendency. the mean of a data set is its arithmetic average. the median of a data set is the middle value in its ordered list. the mode of a data set is its most frequently occurring value.
Answers: 3
You know the right answer?
Taking a test i don’t know anything about please help
In an Economics course, the correlation betwe...
Questions

Business, 02.07.2019 06:30


Social Studies, 02.07.2019 06:30

Biology, 02.07.2019 06:30


Physics, 02.07.2019 06:30
Biology, 02.07.2019 06:30

Mathematics, 02.07.2019 06:30
Mathematics, 02.07.2019 06:30

Mathematics, 02.07.2019 06:30


