
Mathematics, 21.05.2021 01:10 reecce2233
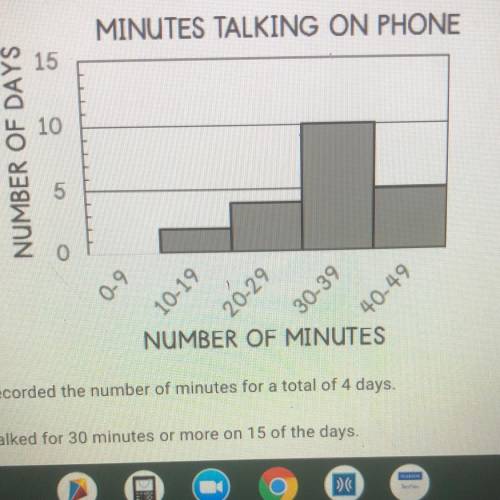
The histogram shows the number of minutes that Carol spent talking on the phone each day over the last few weeks. Which of the following statements is supported by the graph?
A. Carol recorded the number of minutes for a total of 4 days.
B. Carol talked for 30 minutes or more on 15 of the days.
C. Carol talked between 20-29 minutes on 5 of the days.
D. Carol talked between 40-49 minutes on over 50% of the days.

Answers: 1
Another question on Mathematics
Mathematics, 21.06.2019 12:30
The graph of the quadratic function shown on the left is y = –0.7(x + 3)(x – 4). the roots, or zeros, of the function are . determine the solutions to the related equation 0 = –0.7(x + 3)(x – 4). the solutions to the equation are x =
Answers: 1
Mathematics, 21.06.2019 14:30
What is the volume of a rectangular prism if the length is 10.4 mm the width is 5 mm in the height is 8 mm
Answers: 1
Mathematics, 21.06.2019 16:00
Asap for seven months an ice creams vendor collects data showing the number of cones sold a day (c) and the degrees above 70 degrees f the vendor finds that there is a positive linear association between c and t that is the best modeled by this equation c=3.7t+98 which statement is true? the model predicts that the average number of cones sold in a day is 3.7 the model predicts that the average number of cones sold i a day is 98 a model predicts that for each additional degree that the high temperature is above 70 degres f the total of number of cones sold increases by 3.7 the model predicts for each additional degree that the high temperature is above 70 degrees f the total number of cones sold increasingly by 98
Answers: 3
You know the right answer?
The histogram shows the number of minutes that Carol spent talking on the phone each day over the la...
Questions


Biology, 05.04.2020 07:36

History, 05.04.2020 07:36
Mathematics, 05.04.2020 07:36
Mathematics, 05.04.2020 07:36


Computers and Technology, 05.04.2020 07:37

Biology, 05.04.2020 07:38
Mathematics, 05.04.2020 07:39
History, 05.04.2020 07:39


