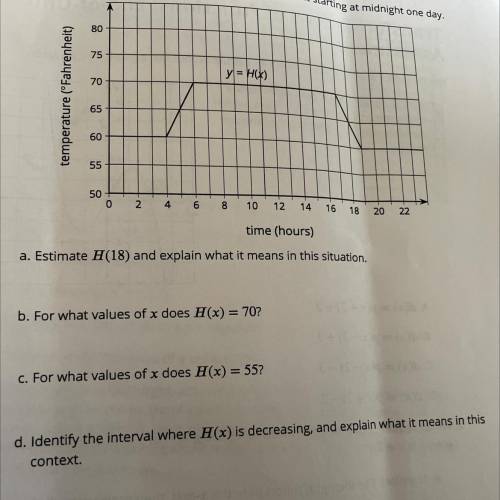
6. This graph represents the temperature in an apartment starting at midnight one day.
80
75<...

Mathematics, 21.05.2021 19:50 mickecia1
6. This graph represents the temperature in an apartment starting at midnight one day.
80
75
y= H(X)
70
temperature (°Fahrenheit)
65
60
55
50
0
2
4
6
8
10
12
14
16
18
20
22
time (hours)
a. Estimate H(18) and explain what it means in this situation.
b. For what values of x does H(x) = 70?
c. For what values of x does H(x) = 55?
d. Identify the interval where F(x) is decreasing, and explain what it means in this
context.

Answers: 3
Another question on Mathematics
Mathematics, 21.06.2019 13:30
Which point is a solution to the inequality shown in this graph (-3,-3)(3,-1)
Answers: 2
Mathematics, 21.06.2019 15:30
Jonah runs 3/5 miles on sunday and 7/10 mile on monday. he uses the model to find that he can ran a total of 1 mile . what mistake does jonah make
Answers: 2
Mathematics, 21.06.2019 16:00
When turned about its axis of rotation, which shape could have created this three-dimensional object?
Answers: 3
Mathematics, 21.06.2019 22:30
3. a sum of $2700 is to be given in the form of 63 prizes. if the prize is of either $100 or $25, find the number of prizes of each type.
Answers: 1
You know the right answer?
Questions
Mathematics, 10.01.2020 05:31

Social Studies, 10.01.2020 05:31

Physics, 10.01.2020 05:31
Mathematics, 10.01.2020 05:31
Mathematics, 10.01.2020 05:31

Chemistry, 10.01.2020 05:31

English, 10.01.2020 05:31

Biology, 10.01.2020 05:31
Mathematics, 10.01.2020 05:31
Social Studies, 10.01.2020 05:31

Social Studies, 10.01.2020 05:31
Biology, 10.01.2020 05:31

History, 10.01.2020 05:31
Mathematics, 10.01.2020 05:31
Social Studies, 10.01.2020 05:31


