
Mathematics, 21.05.2021 22:10 pringleosmond
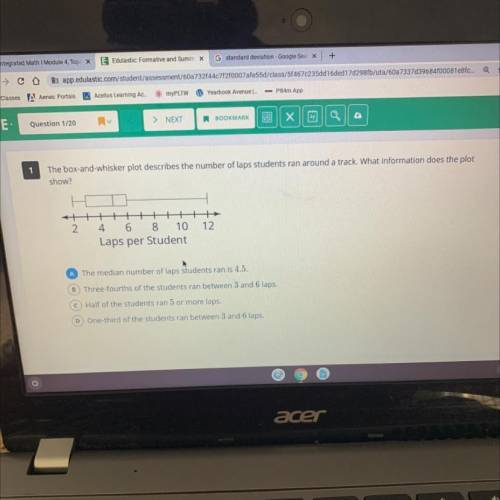
The box-and-whisker plot describes the number of laps students ran around a track. What information does the plot
show?
Laps per Student
A The median number of laps students ran is 4.5.
B Three-fourths of the students ran between 3 and 6 laps.
Half of the students ran 5 or more laps.
One-third of the students ran between 3 and 6 laps.

Answers: 2
Another question on Mathematics
Mathematics, 21.06.2019 22:00
Out of 50 students surveyed, 16 have a dog. based on these results, predict how many of the 280 students in the school have a dog.
Answers: 2
Mathematics, 21.06.2019 23:00
Acaterpillar eats 1400\%1400% of its birth mass in one day. the caterpillar's birth mass is mm grams. which of the following expressions could represent the amount, in grams, the caterpillar eats in one day? \
Answers: 1
Mathematics, 22.06.2019 00:20
Three students, javier, sam, and corrine, participated in a fundraiser where people donated a certain amount of money per lap that the student ran. each student also had some initial donations that were collected before the run. the equations that represent each student's total donation, y, based on the number of laps ran, x, is shown below. match each equation with the correct rate of change for that student.
Answers: 1
Mathematics, 22.06.2019 01:10
Jobs and productivity! how do retail stores rate? one way to answer this question is to examine annual profits per employee. the following data give annual profits per employee (in units of 1 thousand dollars per employee) for companies in retail sales. assume σ ≈ 4.0 thousand dollars. 3.7 6.7 3.6 8.5 7.5 5.9 8.7 6.4 2.6 2.9 8.1 −1.9 11.9 8.2 6.4 4.7 5.5 4.8 3.0 4.3 −6.0 1.5 2.9 4.8 −1.7 9.4 5.5 5.8 4.7 6.2 15.0 4.1 3.7 5.1 4.2 (a) use a calculator or appropriate computer software to find x for the preceding data. (round your answer to two decimal places.) thousand dollars per employee (b) let us say that the preceding data are representative of the entire sector of retail sales companies. find an 80% confidence interval for μ, the average annual profit per employee for retail sales. (round your answers to two decimal places.) lower limit -- thousand dollars upper limit -- thousand dollars (c) let us say that you are the manager of a retail store with a large number of employees. suppose the annual profits are less than 3 thousand dollars per employee. do you think this might be low compared with other retail stores? explain by referring to the confidence interval you computed in part (b). yes. this confidence interval suggests that the profits per employee are less than those of other retail stores. no. this confidence interval suggests that the profits per employee do not differ from those of other retail stores. correct: your answer is correct. (d) suppose the annual profits are more than 6.5 thousand dollars per employee. as store manager, would you feel somewhat better? explain by referring to the confidence interval you computed in part (b). yes. this confidence interval suggests that the profits per employee are greater than those of other retail stores. no. this confidence interval suggests that the profits per employee do not differ from those of other retail stores. (e) find an 95% confidence interval for μ, the average annual profit per employee for retail sales. (round your answers to two decimal places.) lower limit 3.75 incorrect: your answer is incorrect. thousand dollars upper limit 6.41 incorrect: your answer is incorrect. thousand dollars
Answers: 3
You know the right answer?
The box-and-whisker plot describes the number of laps students ran around a track. What information...
Questions
Mathematics, 31.07.2021 15:30


History, 31.07.2021 15:30

Advanced Placement (AP), 31.07.2021 15:30
Mathematics, 31.07.2021 15:30
Mathematics, 31.07.2021 15:30

Mathematics, 31.07.2021 15:30

English, 31.07.2021 15:30

Social Studies, 31.07.2021 15:30

Physics, 31.07.2021 15:30
Social Studies, 31.07.2021 15:30
Mathematics, 31.07.2021 15:30
Chemistry, 31.07.2021 15:30


