
DE
1. 8.SP.1.1
Tony collected data on the years of
employment and the annual salaries o...

Mathematics, 22.05.2021 21:10 deedee2616
DE
1. 8.SP.1.1
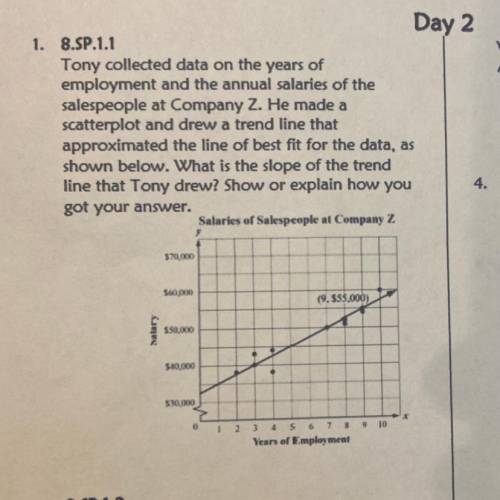
Tony collected data on the years of
employment and the annual salaries of the
salespeople at Company Z. He made a
scatterplot and drew a trend line that
approximated the line of best fit for the data, as
shown below. What is the slope of the trend
line that Tony drew? Show or explain how you
got your answer.
Salaries of Salespeople at Company Z
$70,000
SH0.000
(9.555,000)
Salary
$50,000
$10,000
$10,000
1 2 3 4 5 6 7 8 9 10
Years of Employment

Answers: 3
Another question on Mathematics
Mathematics, 21.06.2019 18:50
Determine which expressions represent real numbers and which expressions represent complex number. asaaap! plis!
Answers: 1
Mathematics, 22.06.2019 01:00
Quadrilateral abcd is translated up and to the right, and then rotated about point q. which congruency statement is correct?
Answers: 1
You know the right answer?
Questions

English, 22.12.2019 06:31

History, 22.12.2019 06:31
History, 22.12.2019 06:31

Mathematics, 22.12.2019 06:31
Mathematics, 22.12.2019 06:31

Geography, 22.12.2019 06:31


