option a is correct.

step-by-step explanation:
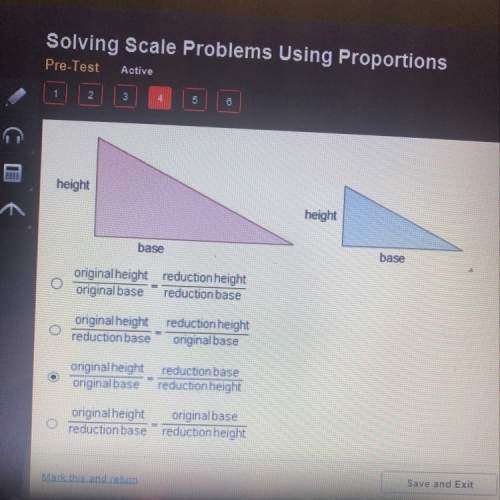
scale factor: it is used to find proportional measurements.
proportions means having the same ratio.
scale factor is the ratio of the model measurement to the actual measurement in a simplest form.
or we can say that the ratio of any two corresponding lengths in two similar geometric figures
if the scale factor is more than 1, then it is an enlargement,
if the scale factor less than 1, then it is a reduction.
given the two geometric figure:
by definition of proportions, we have