
Mathematics, 25.05.2021 21:00 kittybatch345
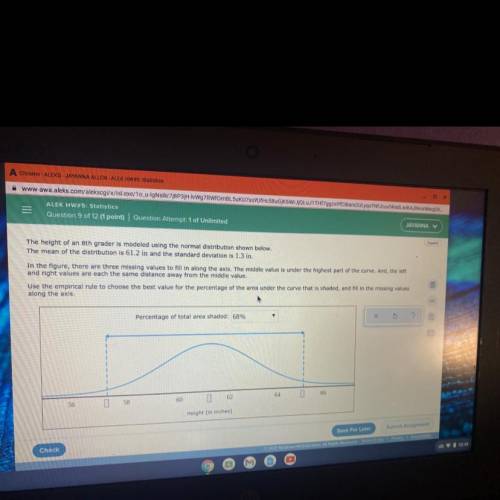
The height of an 8th grader is modeled using the normal distribution shown below.
The mean of the distribution is 61.2 in and the standard deviation is 1.3 in.
In the figure, there are three missing values to fill in along the axis. The midde value is under the highest part of the curve. And, the left
and right values are each the same distance away from the middle value.
Use the empirical rule to choose the best value for the percentage of the area under the curve that is shaded, and nil in the missing values
along the axis.

Answers: 3
Another question on Mathematics
Mathematics, 21.06.2019 20:20
Complete the input-output table for the linear function y = 3x. complete the input-output table for the linear function y = 3x. a = b = c =
Answers: 2
Mathematics, 21.06.2019 21:30
Due to a packaging error, 4 cans labeled diet soda were accidentally filled with regular soda and placed in a 12 pack carton of diet soda. two cans were randomly selected from this 12 pack. what is the probability that both cans were regular soda?
Answers: 2
You know the right answer?
The height of an 8th grader is modeled using the normal distribution shown below.
The mean of the d...
Questions


Mathematics, 30.10.2020 16:20

Engineering, 30.10.2020 16:20

Computers and Technology, 30.10.2020 16:20


