Type the correct answer in each box.
Graph A
T
24
19
20
T
26
T
23
21
22
25
27
Graph B
T
21 22 23
х
T
т
25
24
26
T
28
27
29
30
Graph C
x Х
T
30
23 24
25
T
31
26
27
28
29
32
Graph D
Х
T
27
23
24
25
26
28
29
30
31
32
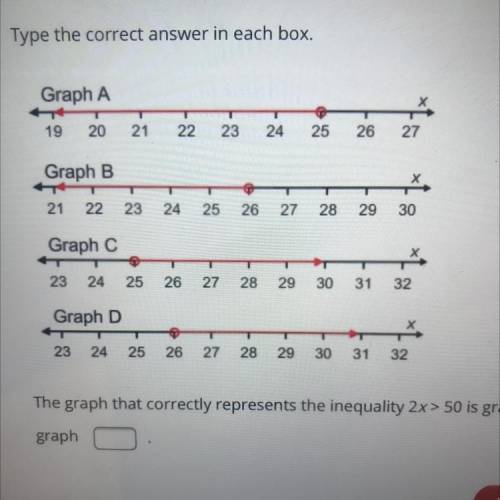
The graph that correctly represents the inequality 2x> 50 is graph
. The graph that correctly repre-
graph
The answers 5 so there’s the you need trust me it’s right
Another question on Mathematics
Mathematics, 21.06.2019 15:40
If the slope of one line equals the slope of another line then ? a) the two lines are intersecting lines b) the two lines are perpendicular lines c) the two lines are parallel lines d) the two lines always have very steep slopes