
Mathematics, 26.05.2021 22:00 grettelyesenia
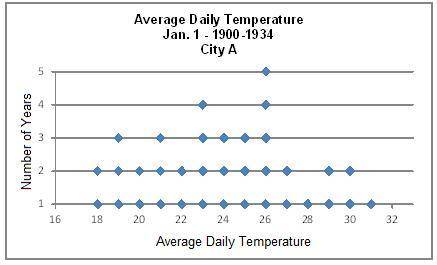
The graph below shows the average daily temperatures on January 1 from 1900 to 1934 for city A. The mean of the temperatures in the chart is 24° with standard deviation of 4°. How many years had temperatures within one standard deviation of the mean?
Answers: 20, 25, 28, 35
TIMED HELP QUICKLY PLEASE!!! 20 pts

Answers: 1


Another question on Mathematics
Mathematics, 21.06.2019 16:00
Use the function f(x) is graphed below. the graph of the function to find, f(6). -2 -1 1 2
Answers: 1
Mathematics, 21.06.2019 16:30
The sales tax rate is 7.25%. how much tax in dollars is added on an item that costs $56.00? a. $4.06 b. $7.25 c. $14.50 d. $60.06
Answers: 2
Mathematics, 22.06.2019 00:30
Find the values of the variables and the lengths of the sides of this kite.
Answers: 3
Mathematics, 22.06.2019 00:50
You are a male who just graduated from college with a bachelor's degree. you have a job paying $50,780.00/yr. a. how does your salary compare to the yearly median earnings for a male with a bachelor's degree? b. what is the difference between the yearly median earnings for a male with a bachelor's degree compared to a male who does not attend college after earning a high school diploma?
Answers: 2
You know the right answer?
The graph below shows the average daily temperatures on January 1 from 1900 to 1934 for city A. The...
Questions

Physics, 03.11.2020 22:20

Mathematics, 03.11.2020 22:20
Mathematics, 03.11.2020 22:20

Mathematics, 03.11.2020 22:20

Social Studies, 03.11.2020 22:20

English, 03.11.2020 22:20
Biology, 03.11.2020 22:20
English, 03.11.2020 22:20
Mathematics, 03.11.2020 22:20
Mathematics, 03.11.2020 22:20


