
Mathematics, 28.05.2021 15:50 NobleWho
PLEASE HELP
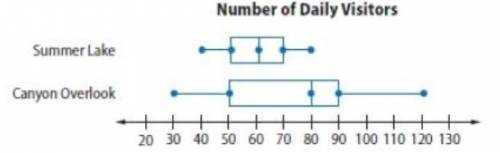
The double box plot below shows the number of daily visitors to two national parks.
Use medians to compare the centers of the data sets.
Which park has greater variability in the number of daily visitors? Show your work.
In general, which park has more daily visitors? Justify your response.
For which park, could you more accurately predict the number of daily visitors on any given day? Explain.

Answers: 1
Another question on Mathematics
Mathematics, 21.06.2019 14:30
In trapezoid efgh, m∠hef=(4x2+16)∘ and m∠gfe=(5x2+12)∘. find the value of x so that efgh is isosceles.
Answers: 1
Mathematics, 21.06.2019 19:30
Identify the number as a rational or irrational.explain. 127
Answers: 1
Mathematics, 21.06.2019 23:00
George writes the mixed number as sum and uses the distributive property 1/2.-2/5=1/2-2+2/5=1/2
Answers: 1
Mathematics, 21.06.2019 23:40
Which is the scale factor proportion for the enlargement shown?
Answers: 1
You know the right answer?
PLEASE HELP
The double box plot below shows the number of daily visitors to two national parks.
Questions


History, 04.08.2019 15:30

Chemistry, 04.08.2019 15:30

Advanced Placement (AP), 04.08.2019 15:30
Mathematics, 04.08.2019 15:30

History, 04.08.2019 15:30


